- Where's the Selling Pressure? (RSP).
- Dow Theory Bull Market Confirmation
- New Leadership Emerges (XLV, XLI, XLF).
- QQQ Gets its Flow Back.
- IJR Flags and IWM Tests Breakout.
- Finance Sector Joins the Fray.
- Notes from the Art's Charts ChartList.
 Where's the Selling Pressure?
There are two parts to an uptrend. First and foremost, a progression of higher highs or rising peaks is necessary to show strong buying pressure. Second, a progression of higher lows or rising troughs is necessary to signal limited selling pressure. Of course, the combination of strong buying pressure and limited selling pressure is ideal.
To take this one step further, I penned an article on how chartists can use RSI to quantify the dips and find symbols with relatively shallow dips. Basically, the lows in RSI reflect the depth of the dip. A move below 40 reflects a mild dip, a move below 35 reflects a deeper dip and a move below 30 reflects an even deeper dip, relatively speaking. The deeper the dip, the stronger the selling pressure.
The chart below shows the Equal-Weight S&P 500 ETF (RSP) with 10-day RSI. I chose 10 days because 14-day RSI rarely exceeds 30/70 and 5-day RSI exceeds 30/70 too often. It is a fielders choice! First and foremost, notice the progression of higher highs from April to September. RSP also recorded fresh 52-week highs in August and September.
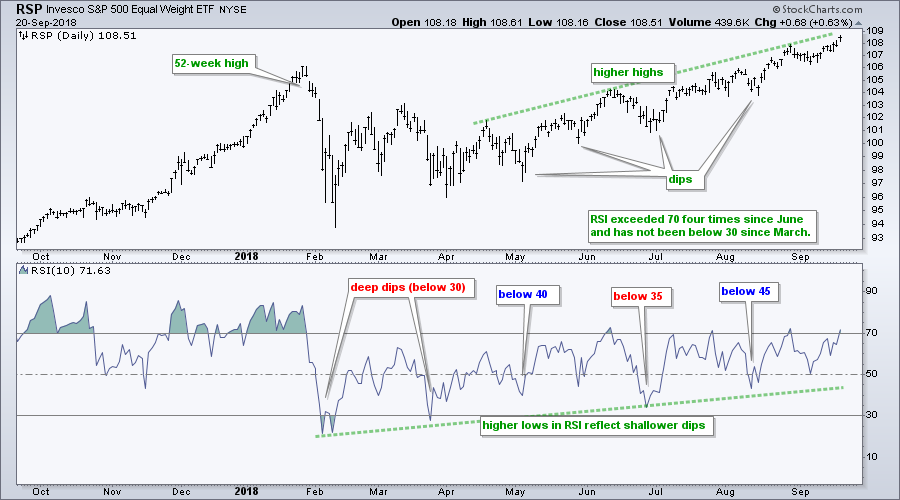
The indicator window shows RSI dipping well below 30 in early February with strong selling pressure. There was another dip below 30 in March, but this was not as deep. The dips since March have not exceeded 30 and RSI has not been below 40 since late June. This reflects limited selling pressure. Throw in four moves above 70 since June and you have a strong uptrend.
Dow Theory Bull Market Signal
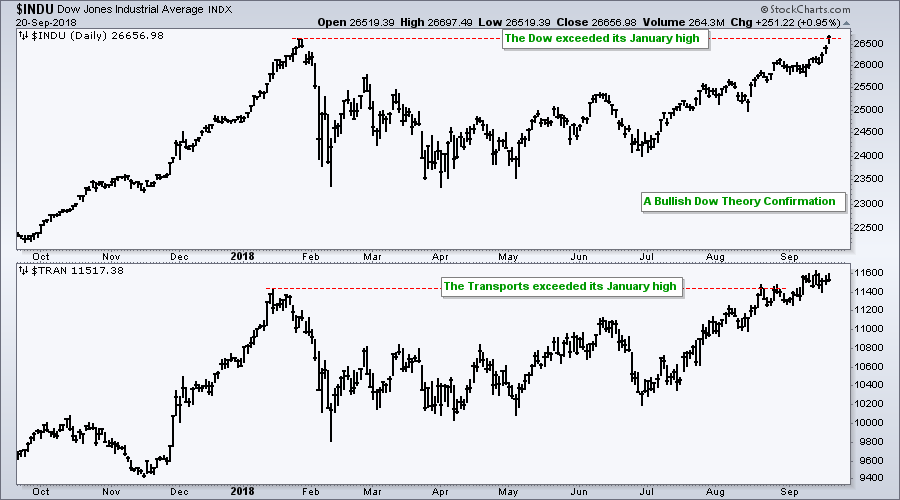
Large-caps led the market higher with the S&P 500 SPDR (SPY) and Dow Diamonds (DIA) hitting new highs this week. The S&P MidCap SPDR (MDY) is a fraction from its all time high and the S&P SmallCap iShares (IJR) is less than 2% from its high. Chartists interested in Dow Theory should note that both the Dow Industrials and Dow Transports hit new highs this month. Thus, the bull market has been affirmed.
New Leadership Emerges
Among the sectors, we have new highs in the Industrials SPDR (XLI), Health Care SPDR (XLV) and Consumer Discretionary SPDR (XLY) this week. The Technology SPDR (XLK) is 1% from a new high and the Financials SPDR (XLF) was the biggest gainer of the week. We also saw new highs in the EW Industrials ETF (RGI), EW Consumer Discretionary ETF (RCD), and EW Healthcare ETF (RYH).
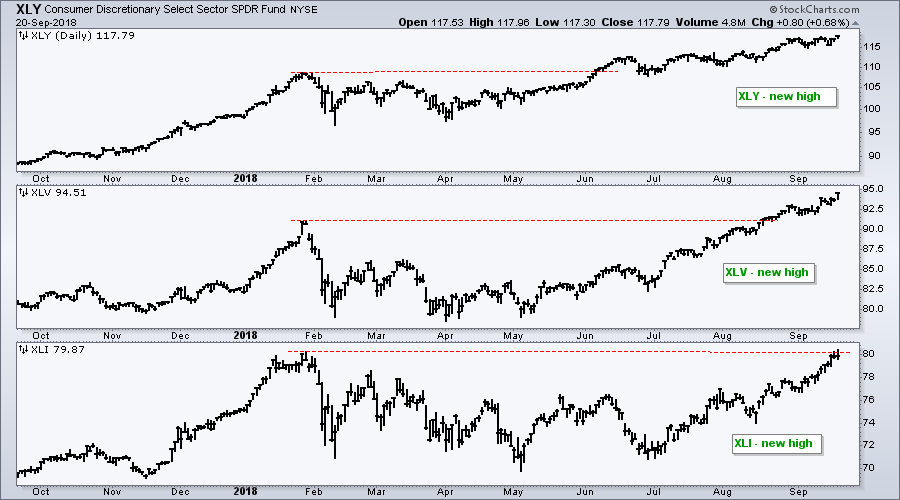
Overall, we have new leadership from the industrials sector and a new high in the small-cap materials sector. I am particularly impressed with the new high in the equal-weight consumer discretionary sector because this is a broad-based ETF that represents the most economically sensitive sector.
Bottom Line: It has been a bull market and it continues to be a bull market. This means we should look for leaders and bullish setups. At the same time, we should avoid the laggards and ignore bearish setups.
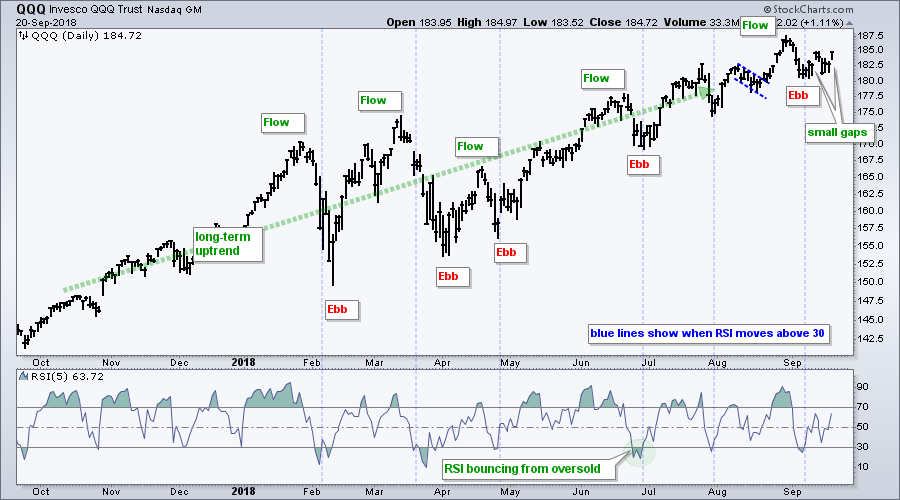
QQQ Gets its Flow Back
I first featured the Nasdaq 100 ETF (QQQ) with an ebb and flow chart a few weeks ago. After flowing to a new high in late August, the ETF ebbed lower into September and is now perking up with a couple of small gaps. Notice that QQQ gapped up the last two Thursdays. Also notice that RSI moved above 30 on September 10th. It looks like the ETF is turning up and preparing for another run for new highs.
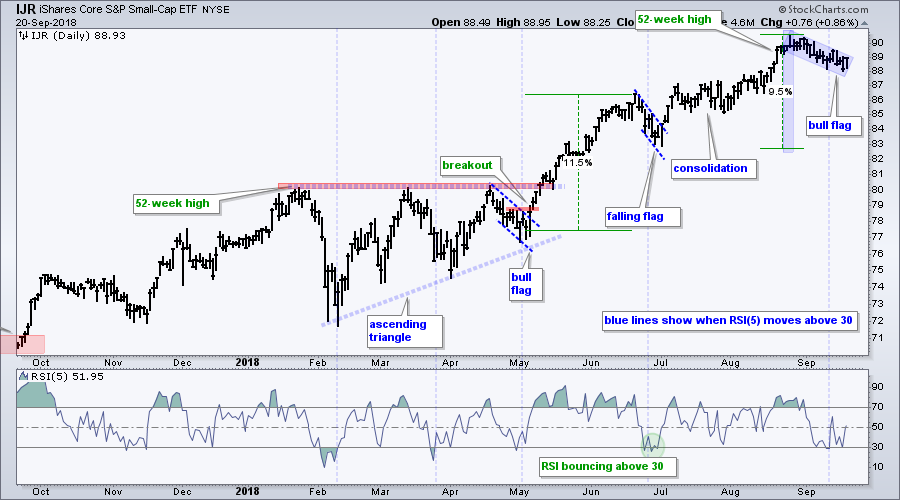
IJR Flags and IWM Tests Breakout
Small-caps are dragging their feet, but the S&P SmallCap iShares (IJR) and Russell 2000 iShares (IWM) are by no means bearish. Both recorded 52-week highs in August and they are leading in 2018. Note that QQQ is up 19% year-to-date, IJR is up 16.5% and IWM is up 13%. On the price chart, IJR advanced around 9% to a new high and then pulled back with a falling flag, which is a bullish continuation pattern. Look for a break above 89.5 to signal a continuation higher.
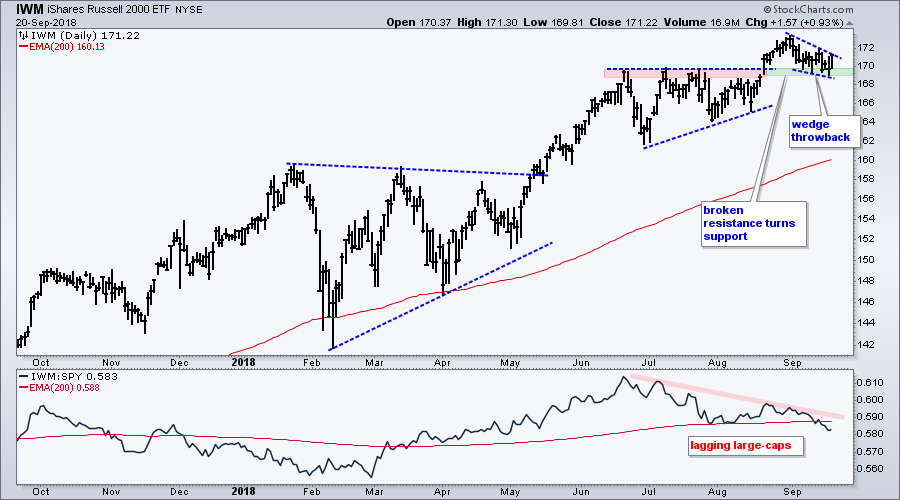
The second chart shows IWM with a classic throwback working. The ETF broke out of an ascending triangle and returned to broken resistance with a throwback. A falling wedge formed the last few weeks and a breakout at 172 would be bullish.
Financials SPDR Joins the Fray
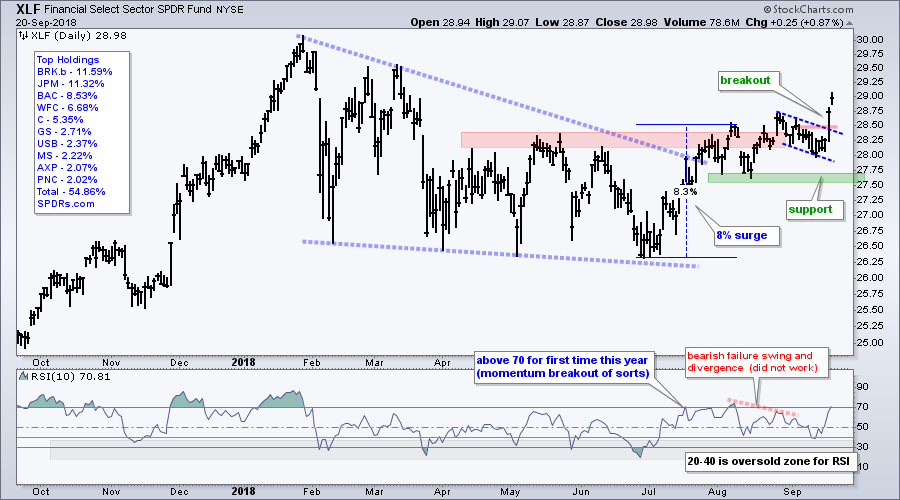
The Technology SPDR (XLK) and the Consumer Discretionary SPDR (XLY) have been leading the market the entire year. Strength expanded when the Health Care SPDR (XLV) broke out in July and led the last three months. The Industrials SPDR (XLI) was next with a breakout in mid August and market leading surge the last five weeks. It now looks like the Financials SPDR (XLF) is ready to join the fray as the ETF broke out to a six month high.
The chart shows XLF with a new high in January and loooonnngggg correction into late June. The ETF sprang to life in July with an 8% surge and then battled the resistance zone in the 28.5 area for several weeks. The bulls kept up the edge and finally broke through with a surge to 29. I will leave key support in the 27.5-27.75 area for now.
I discussed the finance sector and some of the bigger holdings on Wednesday. The charts for the Insurance SPDR (KIE), Broker-Dealer iShares (IAI) and Regional Bank SPDR (KRE) are covered in the industry group ETF charts section of the video. KIE is the clear leader. KRE is a distant second and it got an oversold bounce. IAI remains weak in 2018 with lower highs. Keep in mind that we have a choice and there are better looking charts out there (IMHO).
Notes from the Art's Charts ChartList
The chart laggards bounced over the past week or so as the Dollar fell. I am not sure if the greenback was the main driver, but we did see big bounces in the Metals & Mining SPDR (XME), Steel ETF (SLX), Copper Miners ETF (COPX) and Gold Miners ETF (GDX). Despite big bounces, these ETFs are still week on a long-term basis and there are better looking charts out there. I am not out to pick a bottom on one bounce and would like to see more.
- Chart Leaders: XRT, SKYY, HACK, IGV, IGN, REM, KIE, IYT, ITA, IHI, IHF, MOO
- Chart Laggards: ITB, IAI, KRE, XES, KOL, XME, SLX, COPX, GDX
- Poised for a Bounce?: FDN, IGN, XSD, SOXX, IBB, XBI
- The Cloud Computing ETF (SKYY) hit a new high in August and then consolidated with a triangle or pennant, which is a bullish continuation pattern.
- The Cyber Security ETF (HACK) surged to a new high and then consolidated with a small range (flag) above the breakout zone.
- The Internet ETF (FDN) is still bullish overall and showing signs of strength within the triangle consolidation.
- The Networking iShares (IGN) broke out in August, had a throwback to the breakout zone and it looks like broken resistance is turning into support.
- The Semiconductor iShares (SOXX) gapped up last week, stalled for a few days and broke short-term resistance on Thursday.
- The Software iShares (IGV) has one of the steadiest, and strongest, uptrends.
- The Mortgage REIT ETF (REM) is the most oversold (RSI dip to 32) since the uptrend began in March.
- The Aerospace & Defense iShares (ITA) is still a leader overall, but getting a bit extended and ripe for a rest or pullback.
- The Biotech SPDR (XBI) and Biotech iShares (IBB) pulled back the first two weeks of September and reversed these downswings with short-term breakouts.
- Click here for the Art's Charts ChartList
Questions, Comments or Feedback?
I do not take symbol request and I cannot promise to response to all correspondence, but I will read it and take into under consideration. I greatly appreciate all feedback because it helps me improve the commentary and provides ideas for the future.

Plan Your Trade and Trade Your Plan.
- Arthur Hill, CMT
Senior Technical Analyst, StockCharts.com
Book: Define the Trend and Trade the Trend
Twitter: Follow @ArthurHill


