- Short-term Divided, but Long-term Bullish
- Small-caps Still Struggling
- SPY Leads as QQQ Breaks Wedge
- Tech-Related ETFs Hold Strong (sans SOXX)
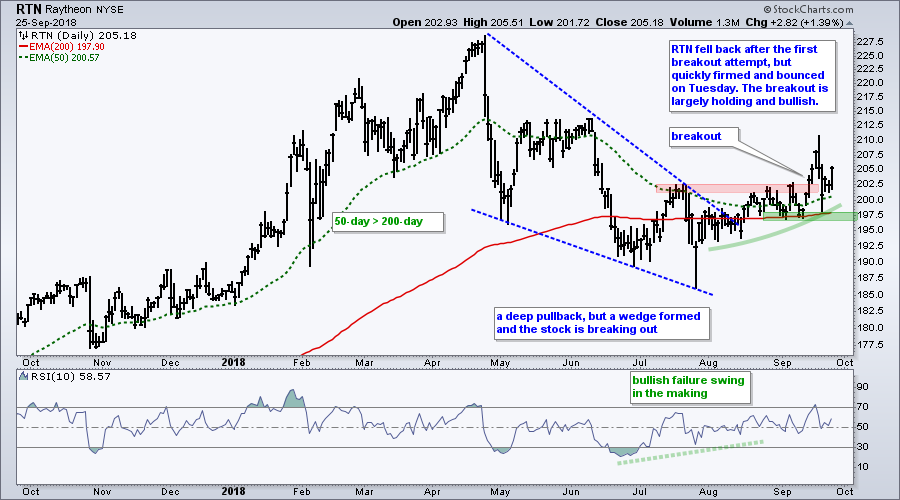
- Chart Setups: ANET, QLYS, NFLX, LMT, RTN
 More Uptrends than Downtrends
Large-caps continue to lead as SPY hit a new high last week and QQQ edged higher the last two weeks. Small-caps (IJR) are in a mild correction and mid-caps (MDY) are flat. Strength in large-caps can be attributed to the Health Care SPDR (XLV), which hit another new high this week, and the Technology SPDR (XLK), which is within 1% of a new high. With the new sector weightings, these two sectors account for around 36% of the S&P 500.
The market is clearly split over the last four weeks and this shows when scanning the S&P 500 for the four week Rate-of-Change. 264 stocks (52.8%) in the S&P 500 are up over the last four weeks and 236 are down (47.2%). This gives a slight edge to the bulls since late August, which is when IJR and IWM started to correct. Year-to-date (185 trading days), 321 stocks are up (64.2%) and 198 (39.6%) are up more than 10%. On the downside, 77 stocks (15.4%) are down more than 10% this year and this is less than half the number of 10% gainers.
Breadth is not a strong as it could be, but there are still more pockets of strength than weakness and this is enough to maintain the grind higher in the major index ETFs.
Scan Code
Here are the three lines of scan code to find the number of stocks with a gain year-to-date. You can change group to SP400 for mid-caps, SP600 for small-caps or NASDAQ100. Change the ROC periods to capture a different timeframe.
[group is SP500]
AND [ROC(185) > 0] // xx-day Rate-of-Change is greater than 0
Rank by ROC(185) // Rank results by Rate-of-Change
Small-caps Still Struggling
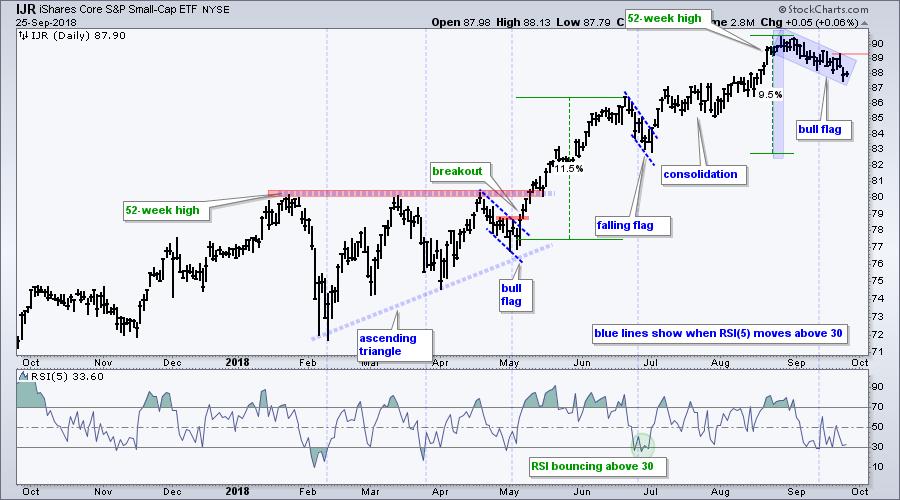
The S&P SmallCap iShares (IJR) remains in a short-term downtrend over the last four weeks. This decline started from a new high in late August and the index is down around 3% from this high. The decline still looks like a correction to me and I am watching for a breakout to signal the end of this correction. A break above 89.5 would reverse the four week slide.
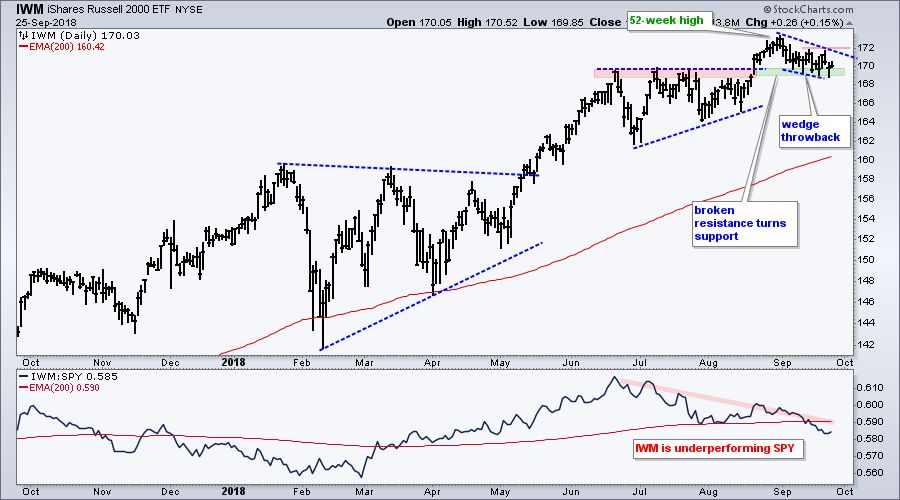
The second chart shows the Russell 2000 iShares (IWM) with an ascending triangle breakout and pullback to the breakout zone, which turns into support. Watch 172 for a wedge breakout that would signal a resumption of the bigger uptrend.
SPY Leads as QQQ Breaks Wedge
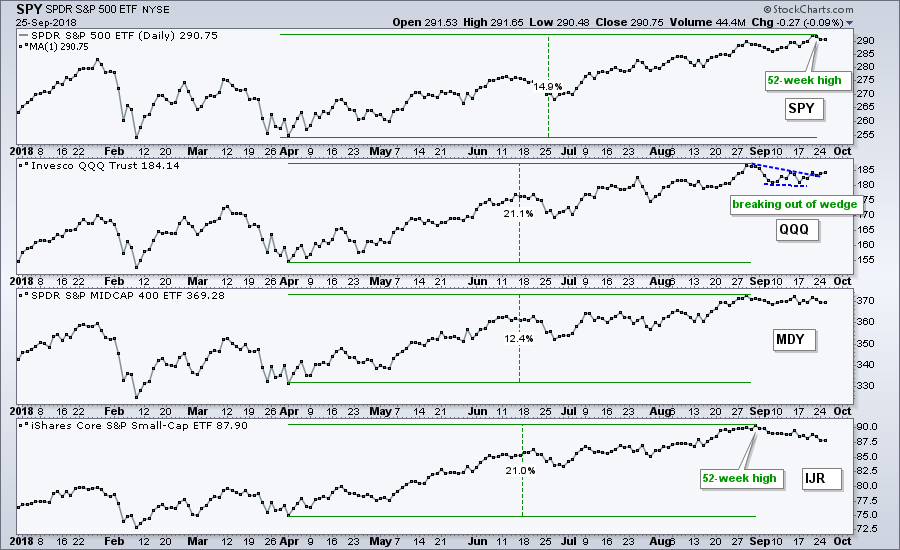
The next chart shows close only prices for SPY, QQQ, MDY and IJR (large-caps, large-techs, mid-caps and small-caps). SPY is clearly leading because it hit a 52-week high last week. The other three recorded 52-week highs in late August and corrected the last few weeks. QQQ formed a small wedge and edged above the wedge line over the last few days. It looks like the correction in QQQ is ending and this could open the door to new highs.
Tech-Related ETFs Hold Strong (sans SOXX)
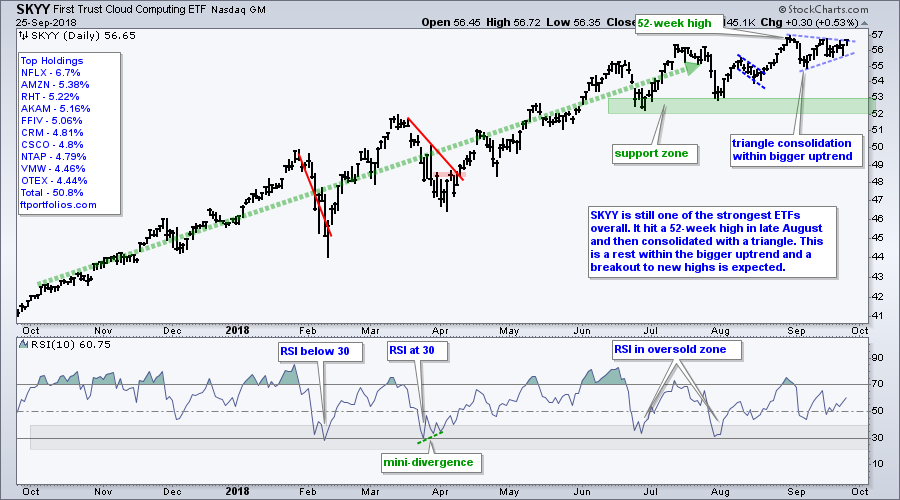
The Cloud Computing ETF (SKYY), Cyber Security ETF (HACK), Internet ETF (FDN) and Software iShares (IGV) are holding up well, but the Semiconductor iShares (SOXX) and Semiconductor SPDR (XSD) were hit with selling pressure on Tuesday. Let's review the leaders first. The first chart shows SKYY with a new high in late August and a triangle consolidation the last few weeks. This is a consolidation within an uptrend and an upside breakout is expected. Why? Because the bigger trend is up and the bigger trend is the dominant force at work.
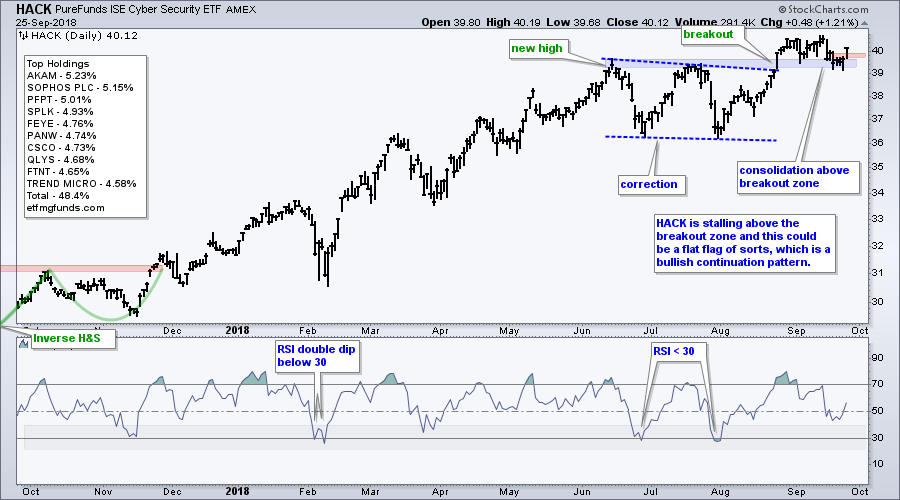
 HACK broke out with a surge in August and the breakout zone turns into the first support zone to watch. The ETF basically consolidated above this breakout zone with a trading range. Even though it does not look like a picture-perfect flag, it is a consolidation after a sharp surge and a continuation is expected. The first signs of strength appeared on Tuesday as the ETF surged over 1%.
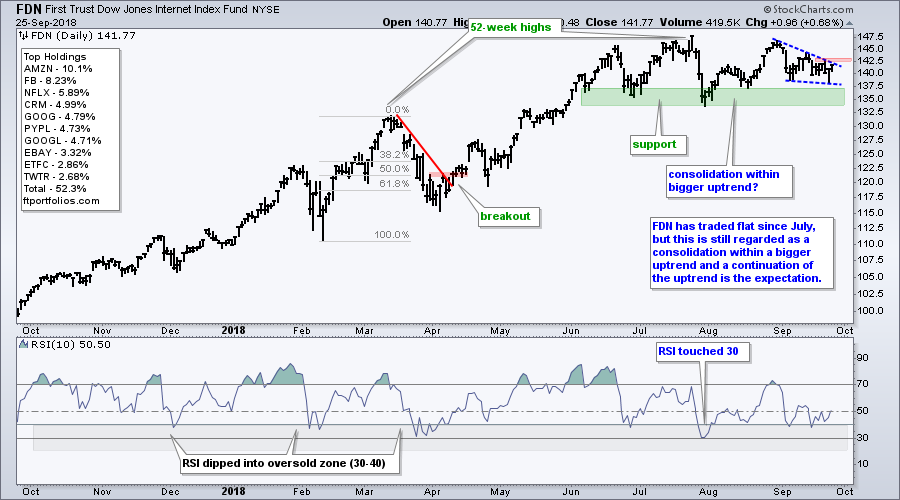
 The Internet ETF (FDN) is lagging the other two because it did not record a new high in August. However, the long-term trend is up and the ETF is consolidating above the big support zone. A wedge formed over the last few weeks and a breakout at 143 would be bullish.
 The Semiconductor iShares (SOXX) is the weakest tech-related ETF because it peaked in March and formed lower highs the last few months. The green oval shows when there was a gap down, reversal day and gap up in mid September. The ETF even broke out at 188 last week, but this mini-breakout did not hold as the ETF fell sharply on Tuesday. There are stronger charts out there and SOXX is not going far as long as INTC, its top component, trends lower.
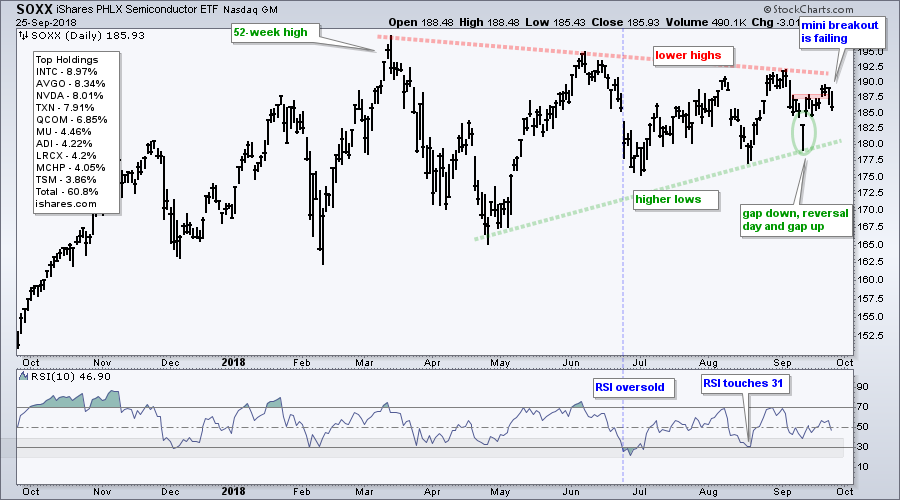
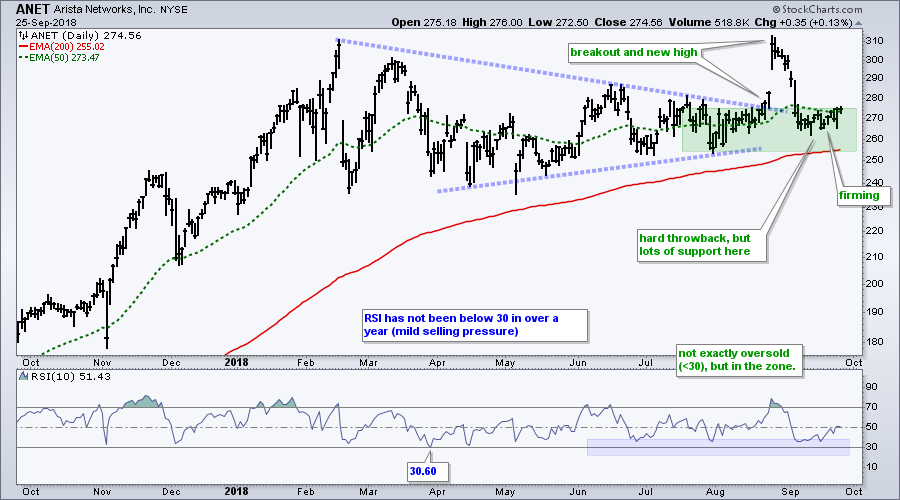
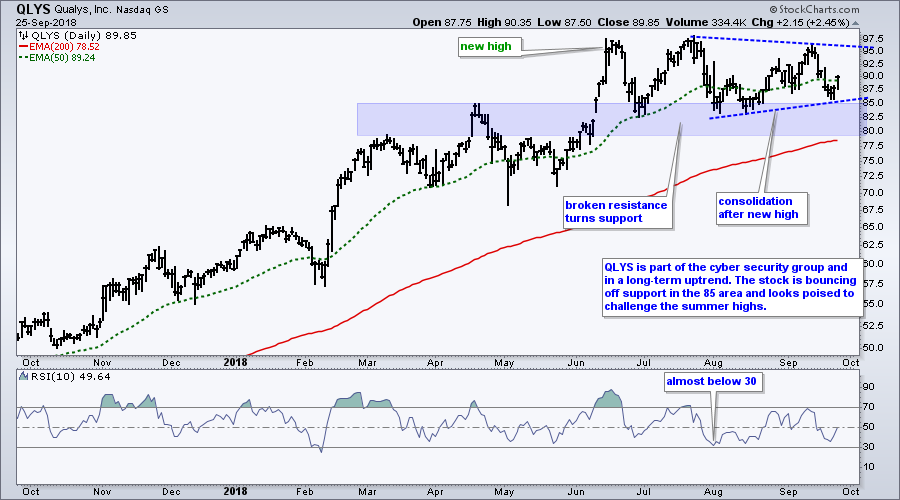
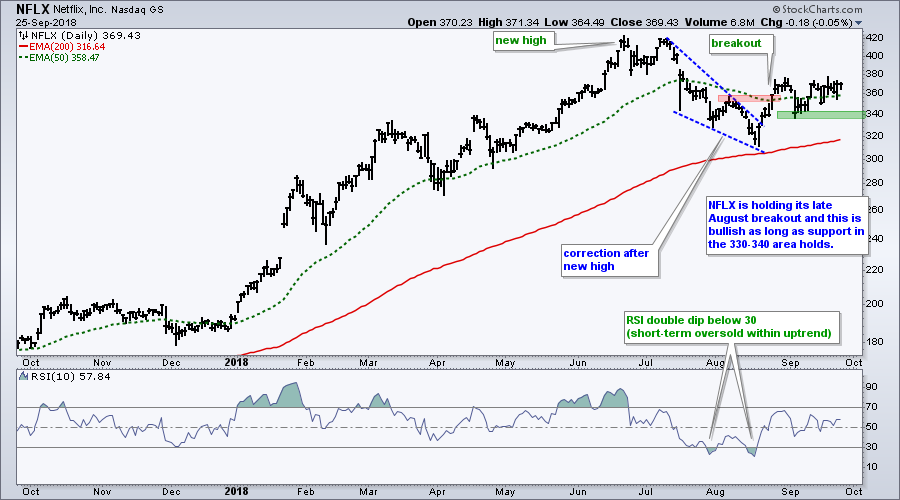
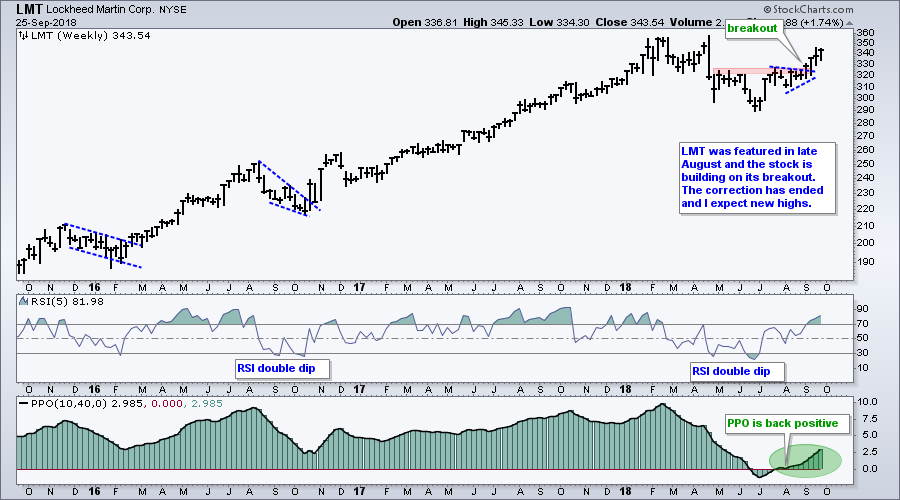
Chart Setups: ANET, QLYS, NFLX, LMT, RTN
On Trend on Youtube
Available to everyone, On Trend with Arthur Hill airs Tuesdays at 10:30AM ET on StockCharts TV and repeats throughout the week at the same time. Each show is then archived on our Youtube channel.
Topics for Tuesday, September 25th:
- SPY and QQQ Lead as IJR and MDY Stall.
- Exploring Changes in XLK and XLY (plus XLC).
- Top 10 Stocks in XLK and XLC (GOOGL, AAPL, FB, AMZN...).
- Tech ETFs Still Strong (SKYY, FDN, IGN, HACK, SOXX).
- #AskArthur (Coppock, XLC and XLRE, Monthly vs Daily).
- Stocks to Watch: ADSK, WDAY, NOW, VRTX.
- Click here to Watch
Questions, Comments or Feedback?
I cannot promise to response to all correspondence, but I will read it and take into under consideration. I greatly appreciate all feedback because it helps me improve the commentary and provides ideas for the future. Sorry, I do not take symbol requests.

Plan Your Trade and Trade Your Plan.
- Arthur Hill, CMT
Senior Technical Analyst, StockCharts.com
Book: Define the Trend and Trade the Trend
Twitter: Follow @ArthurHill
