- Introduction.
- RSI for Trend Identification.
- RSI to Quantify Pullbacks.
- Scan Code Progression.
- Conclusions and Tweaks.
 Introduction
Stocks making big upside moves and higher highs are clearly in uptrends, but this says little about the length of the trend or the depth of the pullbacks. Trends have a tendency to persists and this is why it is important to find established uptrends, not just newly minted uptrends. In addition, the ideal uptrend is one with relatively tame pullbacks, not big downswings and upswings. This SystemTrader article will show how to use RSI to scan for established uptrends and quantify the pullbacks along the way.
RSI for Trend Identification
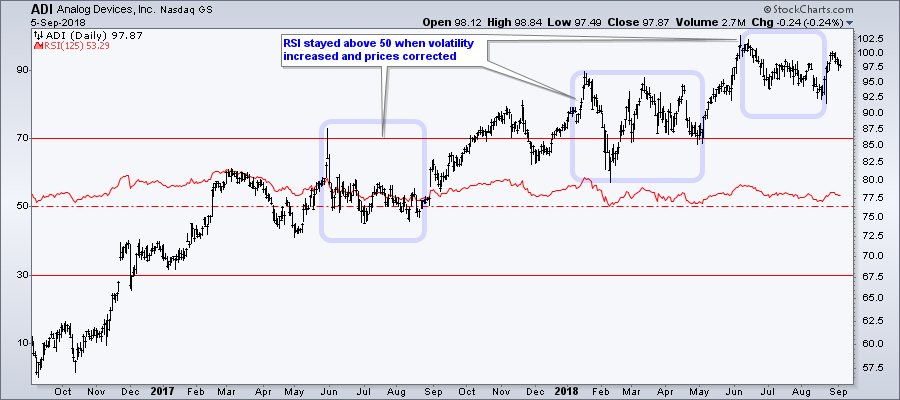
Chartists mostly associate RSI with momentum, but it can also be used as an effective trend indicator. In this example, I am looking for established uptrends by requiring 125-day RSI to be above 50 for at least 125 days. 125 days captures six months and 50 is the midpoint of the RSI range. Thus, the cup is half full (uptrend) when RSI is above 50 and half empty when below.
The example below shows a two year bar chart with RSI(125) behind the price bars. Note that RSI stayed above 50 for over two years and captured this uptrend quite well. I especially like the fact that 125-day RSI was able to weather the periods when volatility increased or when the stock merely corrected.
RSI to Quantify Pullbacks
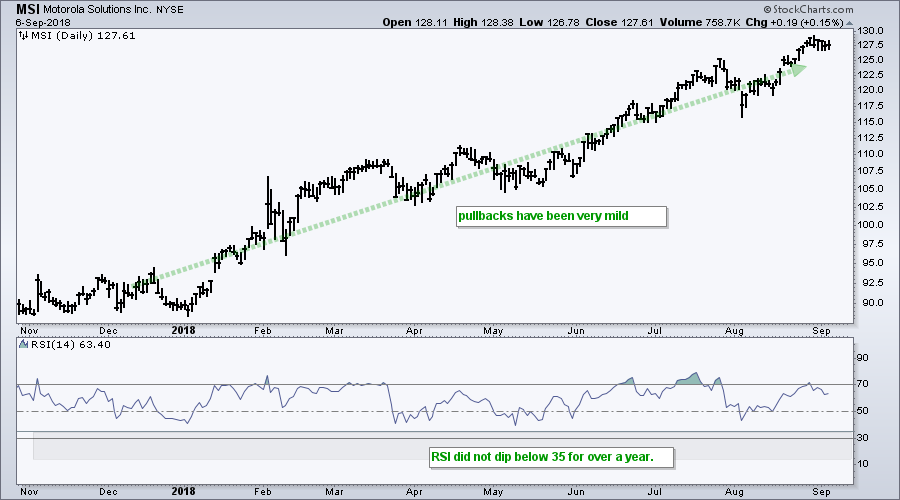
Next I am turning to the default setting for RSI to measure depth of the pullbacks. In particular, I would like the minimum value of RSI(14) to be above 30 over the last 125 days. This means RSI did not dip below 30 during this period. The ability to hold above 30 for six months indicates that the dips were not that deep. In other words, selling pressure during the declines was contained.
In order to keep this measurement uniform, I would also like the maximum value of RSI(14) to be above 70 over the last 125-days. This means buying pressure was strong enough to push RSI above 70 at some point. Put another way, the upside impulses were stronger than the downside impulses because RSI exceeded 70 and did not exceed 30.
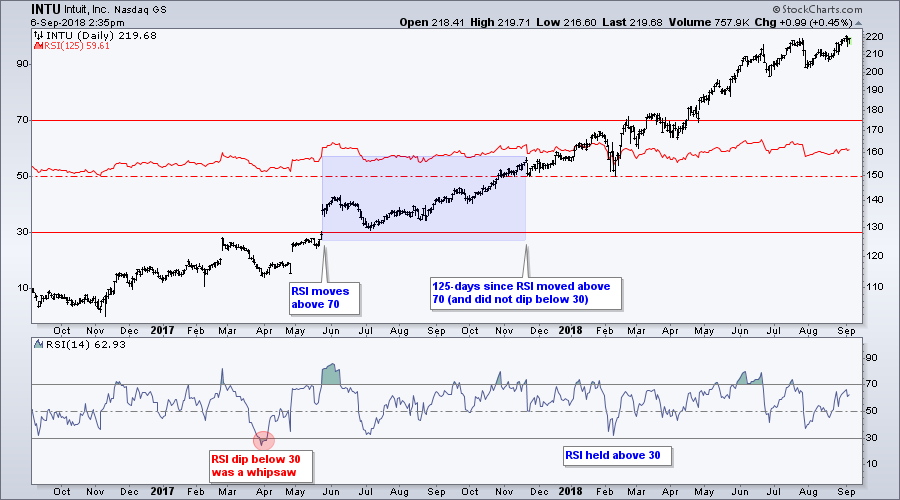
The next chart shows Intuit with RSI(14) in the lower window. Notice that RSI has not dipped below 30 since March 2017 and exceeded 70 numerous times. Admittedly, the dip below 30 in March did not result in a trend change, but it did reflect an increase in selling pressure intensity. Despite this dip below 30, INTU moved to a new high in June. No indicator is perfect.
Scan Code Progression
The scan code provides a good example for the MIN and MAX functions. The first line scans for stocks in the S&P 500. The second line scans for stocks where RSI(125) has been above 50 for at least 125 days. The third line scans for stocks where RSI(14) did not dip below 30 for at least 125 days. The fourth line scans for stocks where RSI(14) exceeded 70 at least once over the last 125-days.
[Group is SP500] // line 1
and [Min(125,RSI(125)) > 50] // line 2
and [Min(125,RSI(14)) > 30] // line 3
and [Max(125,RSI(14)) > 70] // line 4
We started the scan with the 500 stocks in the S&P 500. After executing the first scan line, the number fell to 139 stocks. Thus, as of the close on Wednesday (6-Sep), RSI(125) has been above 50 for 125 days or more for 139 stocks (27.8%).
Requiring RSI(14) to be above 30 for at least 125 days reduced this number to 121 stocks (line 3). Requiring RSI(14) to be above 70 at least once over the last 125 days reduced this number to 110 stocks (line 4).
Conclusions and Tweaks
Chartists can use the techniques above to narrow down a list of stocks and focus only on those in established uptrends. I am using 125 days because it amounts to around six months and this is my minimum requirement for an established uptrend. This lookback period can be shortened or lengthened depending on your preferences.
I am using 30 as my line in the sand for pullbacks in RSI(14), but this level can also be adjusted to look for even shallower pullbacks. For example, tightening the requirement from 30 to 35 would greatly reduce the number of stocks in the scan results (from 110 to 61).
Such a change in line 2 would yield an elite group of stocks with established uptrends and very shallow pullbacks. After all, this means RSI(14) did not dip below 35 over the last 125 days. These include ADBE, CNC, CTAS, FFIV, HFC, INTC, MA, MSI, PYPL, TDG and ZTS. Check out some of these charts if you are looking for some steady and established uptrends.
Questions, Comments or Feedback?
I cannot promise to response to all correspondence, but I will read it and take into under consideration. I greatly appreciate all feedback because it helps me improve the commentary and provides ideas for the future. Sorry, I do not take symbol requests.

Plan Your Trade and Trade Your Plan.
- Arthur Hill, CMT
Senior Technical Analyst, StockCharts.com
Book: Define the Trend and Trade the Trend
Twitter: Follow @ArthurHill


