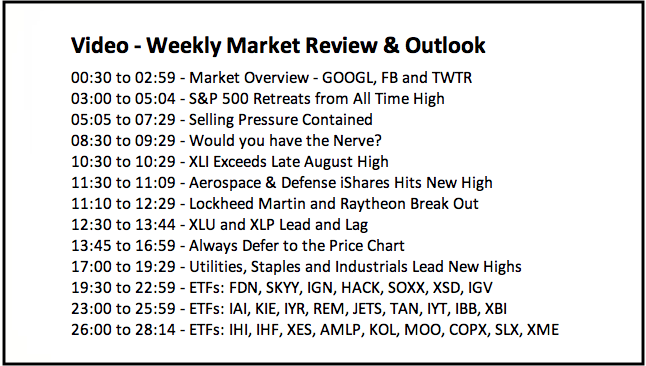
- Market Overview.
- S&P 500 Retreats from All Time High.
- Would you have the Nerve?
- Selling Pressure Contained.
- XLI Exceeds Late August High.
- Aerospace & Defense iShares Hits New High.
- Lockheed Martin and Raytheon Break Out.
- XLU and XLP Lead and Lag.
- Always Defer to the Price Chart.
- Utilities, Staples and Industrials Lead New Highs.
- Notes from the Art's Charts ChartList.
 ...Market Overview - Social Media Sinks
...The major index ETFs retreated a little this week with the tech-laden Nasdaq 100 ETF leading the way. The declines were relatively muted though and selling pressure was not that intense, except for a few of the social media and content names.
Alphabet (GOOGL) is down around 8% from its summer highs, Facebook (FB) is down 25% and Twitter (TWTR) is down 35%. These big moves are weighing on the Nasdaq 100 ETF and the newly minted Communication Services SPDR (XLC), which is down around 7% from its summer highs.
Facebook and Twitter look broken and may need time to heal, but the decline in Alphabet could be just a correction after a 52-week high.
Once again, we are seeing pockets of weakness and pockets of strength in the broader market, but the pockets of strength outweigh the pockets of weakness. This week we will take a look at the industrials sector because it represents a pocket of strength, along with the Aerospace & Defense iShares.
S&P 500 Retreats from All Time High
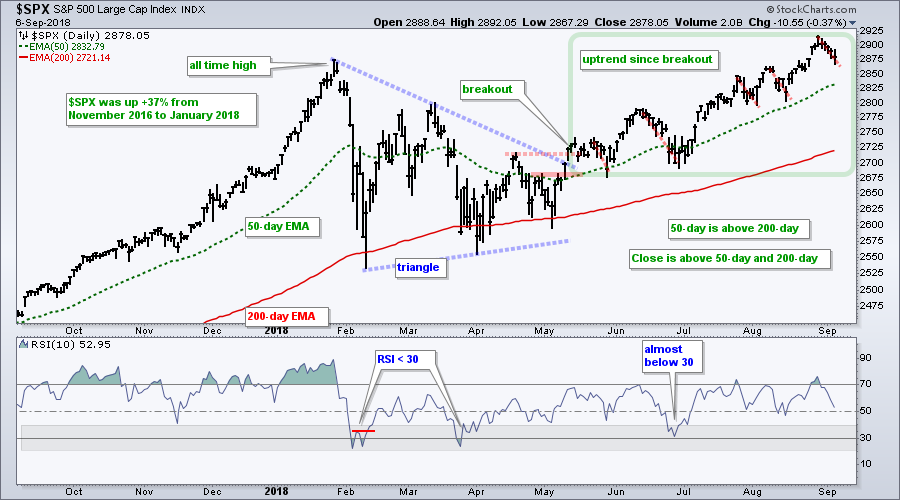
The S&P 500 fell four of the last five days with a 1.24% decline from its recent high. It is not much of a pullback thus far. The red dashed lines show the last five pullbacks since the May breakout and the June pullback was the deepest. I do not know how far this pullback will extend, but I still view it as a correction within a bigger uptrend. SPX hit a new high in late August, the 50-day is above the 200-day and price is well above the rising 200-day. Taking a guess, we could see a pullback to the 50-day and then some sort of bounce, which is what occurred in June.
Selling Pressure Contained
Right away we can see that a 5 day decline of 1.14% is not very drastic. The mildness of the current decline can be seen in the breadth indicators as well. The chart below shows the 10-day EMA for AD Percent for the S&P 500, S&P Mid-Cap 400 and S&P Small-Cap 600. Focusing on the S&P 500 in the second window, notice that there were several moves above +20% from April to August and not one move below -20%. The same holds for the S&P Mid-Cap 400 and S&P Small-Cap 600. I would not view selling pressure as intense until we see some moves below -20% in this indicator.
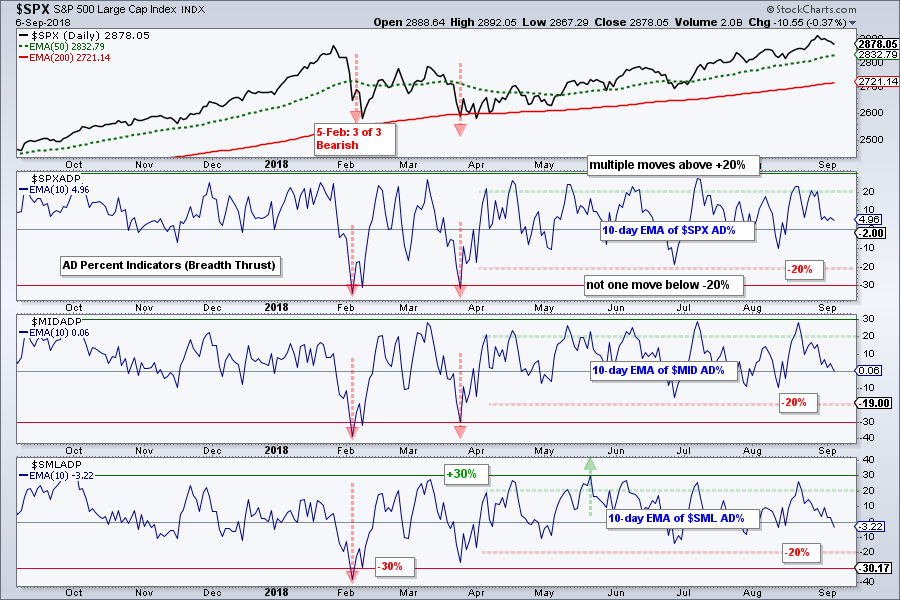 Note that I mark a bullish breadth thrust with a move above +30% and a bearish thrust with a move below -30%. These signals are explained in this article on breadth. All three triggered bearish breadth thrusts in January and two of the three triggered in March (small-caps did not). Small-caps triggered bullish in May, but large-caps and mid-caps have yet to see a truly strong bullish breadth thrust because pockets of weakness prevented this breadth thrust. Because the range narrowed the last few months, I am now watching -20% for the first sign of significant selling pressure
Would you have the Nerve?
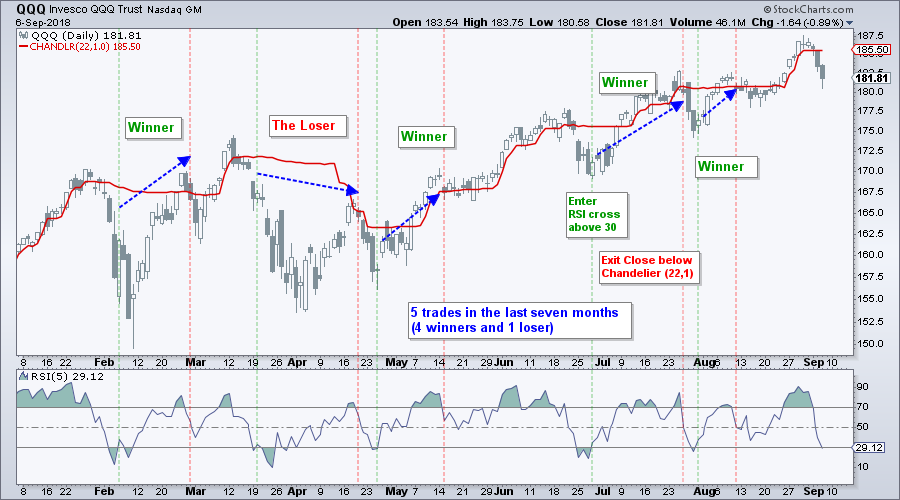
Yep, it is getting to be that time again. 5-day RSI moved below 30 for the Nasdaq 100 ETF and Proshares Ultra QQQ (QLD). This means a mean-reversion setup is active and a signal will trigger when RSI moves back above 30. Note that the other ETFs have yet to become short-term oversold (SPY, MDY and IJR). You can read all about this strategy in this System Trader article from March. Note that I added the PPO for the exit strategy in that article, but the Chandelier Exit alone seems to work just as good. Caveat Emptor: Past performance does not guarantee future results.
XLI Exceeds Late August High
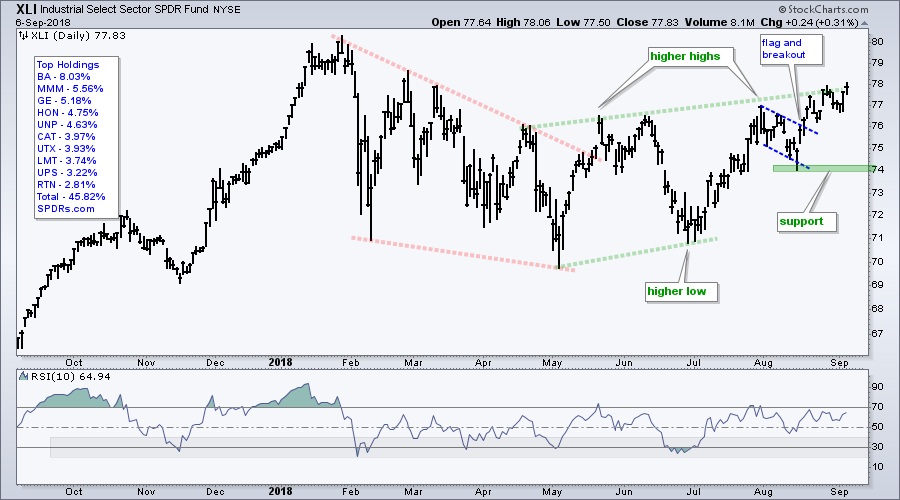
The major index ETFs all fell over the last five trading days, but one offensive sector bucked the selling pressure and edged higher. The Industrials SPDR (XLI) moved slightly higher over the last five trading days and exceeded its late August high. On the price chart, XLI formed a higher low from May to June and higher highs from April to May to August (and now September). The ETF is also up around 10% from its late June low and the second best performing sector over the last ten weeks (XLV is tops with a 11% gain).
Aerospace & Defense iShares Hits New High
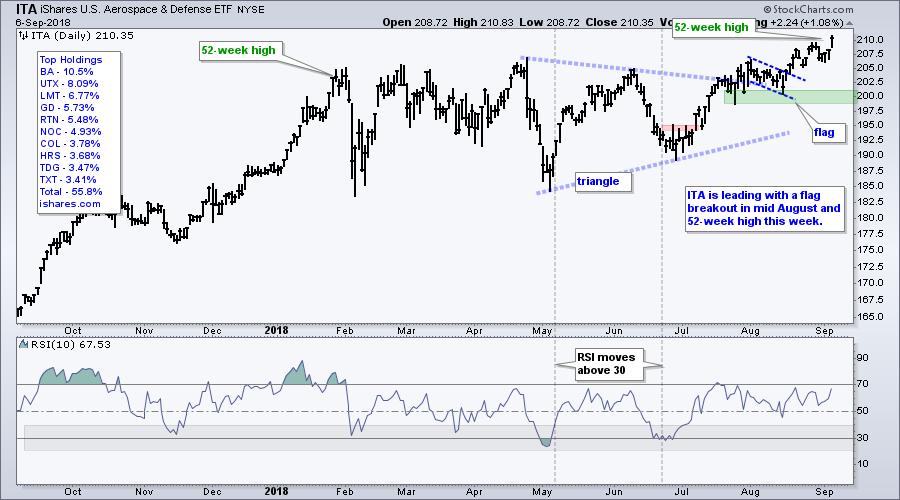
Within the industrials sector, we are seeing upside leadership from the Aerospace & Defense iShares (ITA) because it recorded a 52-week high. Note that ITA and six defense stocks were highlighted in Art's Charts on August 31st. On the price chart, ITA turned up within the triangle in mid July, broke out of the triangle in late July and hit new highs over the last few weeks.
Lockheed Martin and Raytheon Break Out
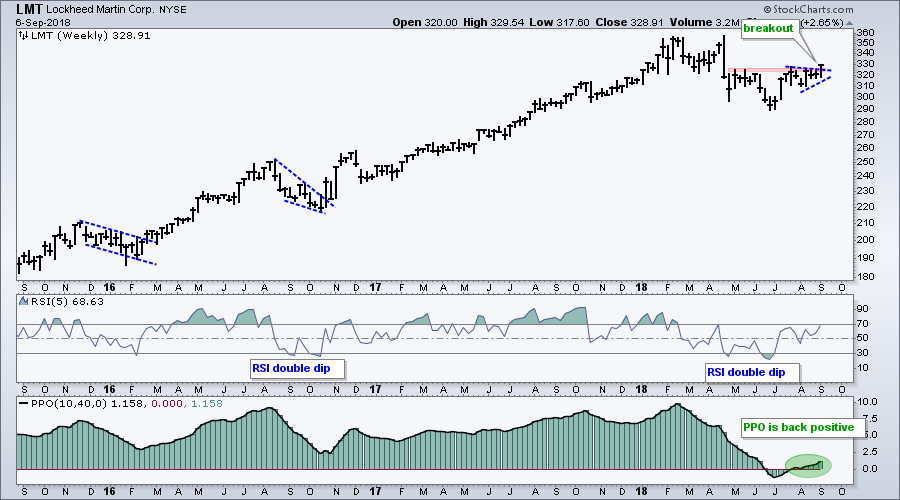
The first chart shows Lockheed Martin (LMT) hitting a new high in January and then correcting into early July. The stock surged to the red resistance zone in mid July, consolidated and broke out of the consolidation this week. It looks like the correction is ending and the bigger uptrend is resuming.
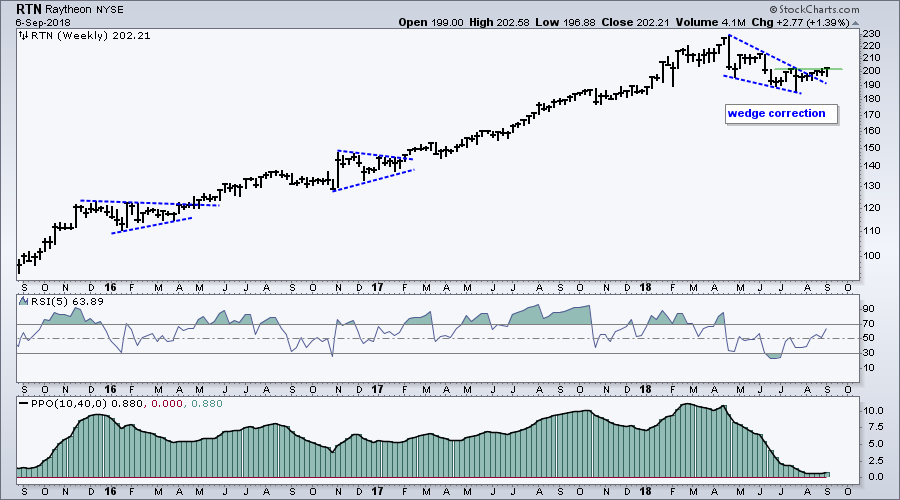
 The second chart shows Raytheon (RTN) hitting a new high in April and then correcting with a falling wedge into July. The stock stabilized in the 190-200 area for several weeks and challenged the July high with a bounce this week. A breakout here would end the correction and signal a continuation of the bigger uptrend. A close below 190 would call for a re-evaluation.
XLU and XLP Lead and Lag
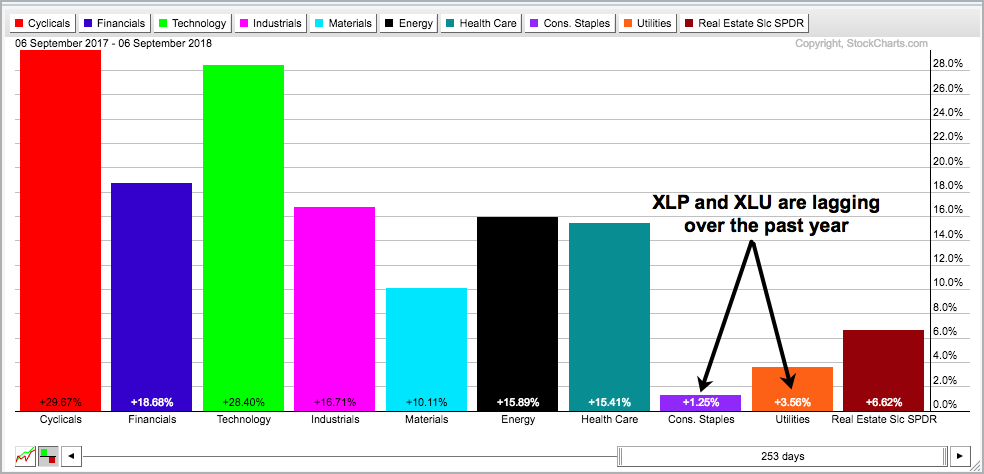
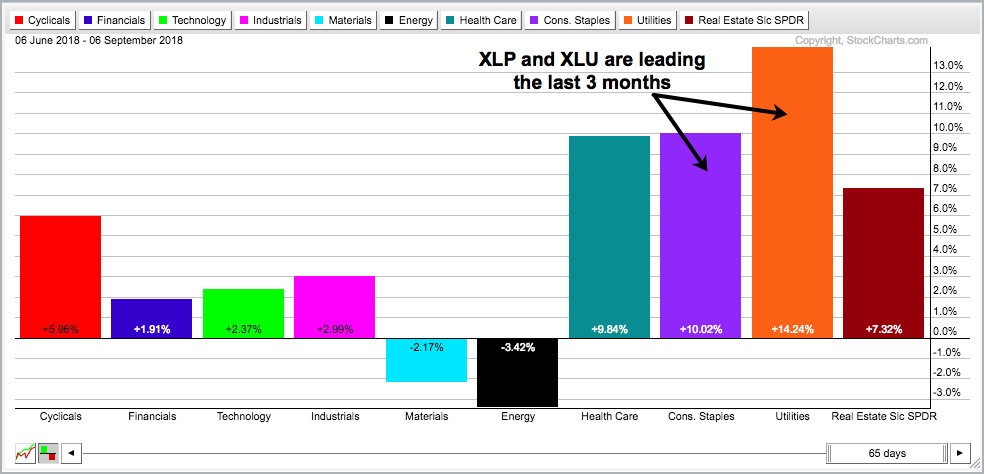
Performance and trend are dependent on the timeframe you pick and the Consumer Staples SPDR (XLP) and Utilities SPDR (XLU) offer great examples. These two sectors are lagging on the one year timeframe and well below their 52-week highs, but in strong uptrends on the three month timeframe and leading the ten sector SPDRs. XLU is up just 3.56% over the past year, but up a whopping 14.24% the last three months (June 6th to September 6th. Similarly, XLP is up 1.25% over the past year, but up 10% over the last three months.
Always Defer to the Price Chart
Relative performance is interesting, but we must always turn to the chart at some point. Even though I just showed a PerfChart, my preference is to start with the price chart and finish with the price chart. Nine times out fo ten, all the information we need is right there on the price chart.
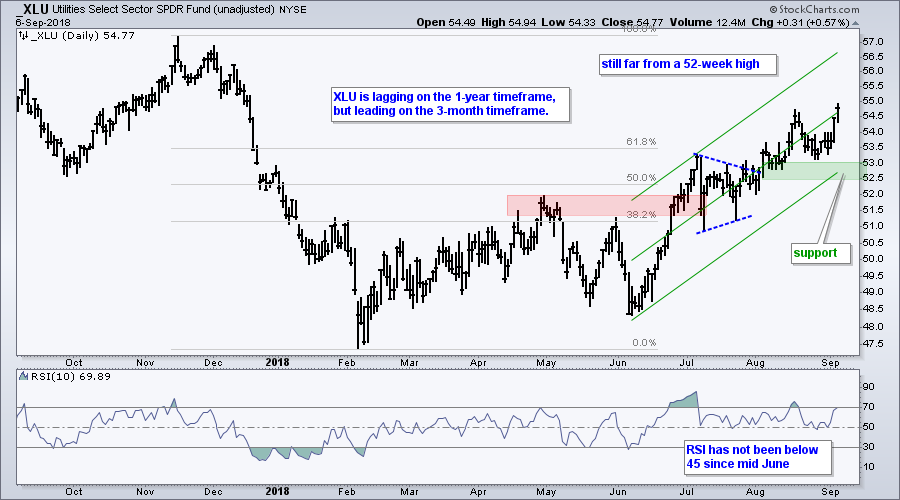
The chart shows unadjusted Utilities SPDR (_XLU) below its 52-week high, which was in November. I am using unadjusted data because dividends play a big role for utilities and I want to see what the chart looks like when the tide goes out ("After all, you only find out who is swimming naked when the tide goes out." - Warren Buffet).
XLU broke out with a surge in June, consolidated with a triangle into July and broke out again in early August. There was a small throwback in late August and the ETF moved above its August high this week. Anything that exceeded its August high and is up in September is showing some form of leadership.
 The next chart shows unadjusted XLP with a steady advance from May to August and a pullback from late August to early September. This pullback abruptly ended with a two day surge and it looks like XLP is poised to extend its uptrend.
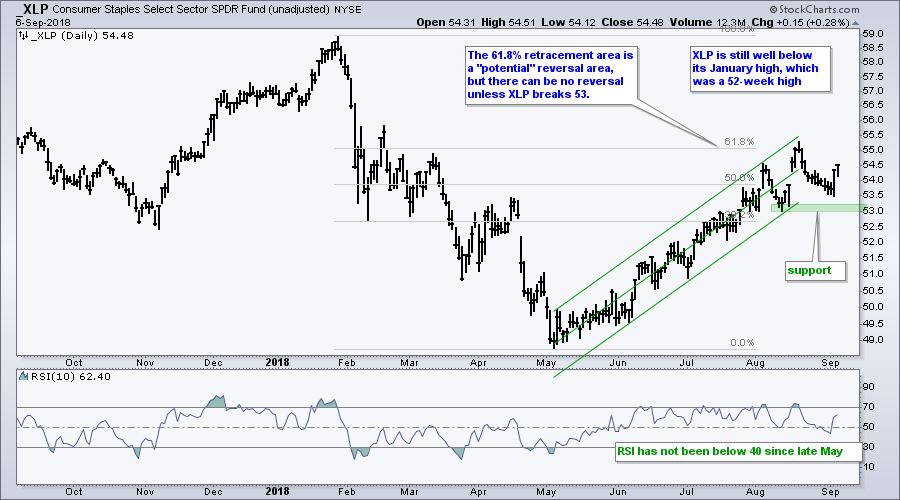 The indicator windows in both charts show RSI(14). Note that RSI has not been below 40 since late May for XLP and below 45 since mid June for XLU. The shallow dips in RSI reflect shallow pullbacks on the price chart and this indicates buying pressure coming in after short pullbacks.
Utilities, Staples and Industrials Lead New Highs
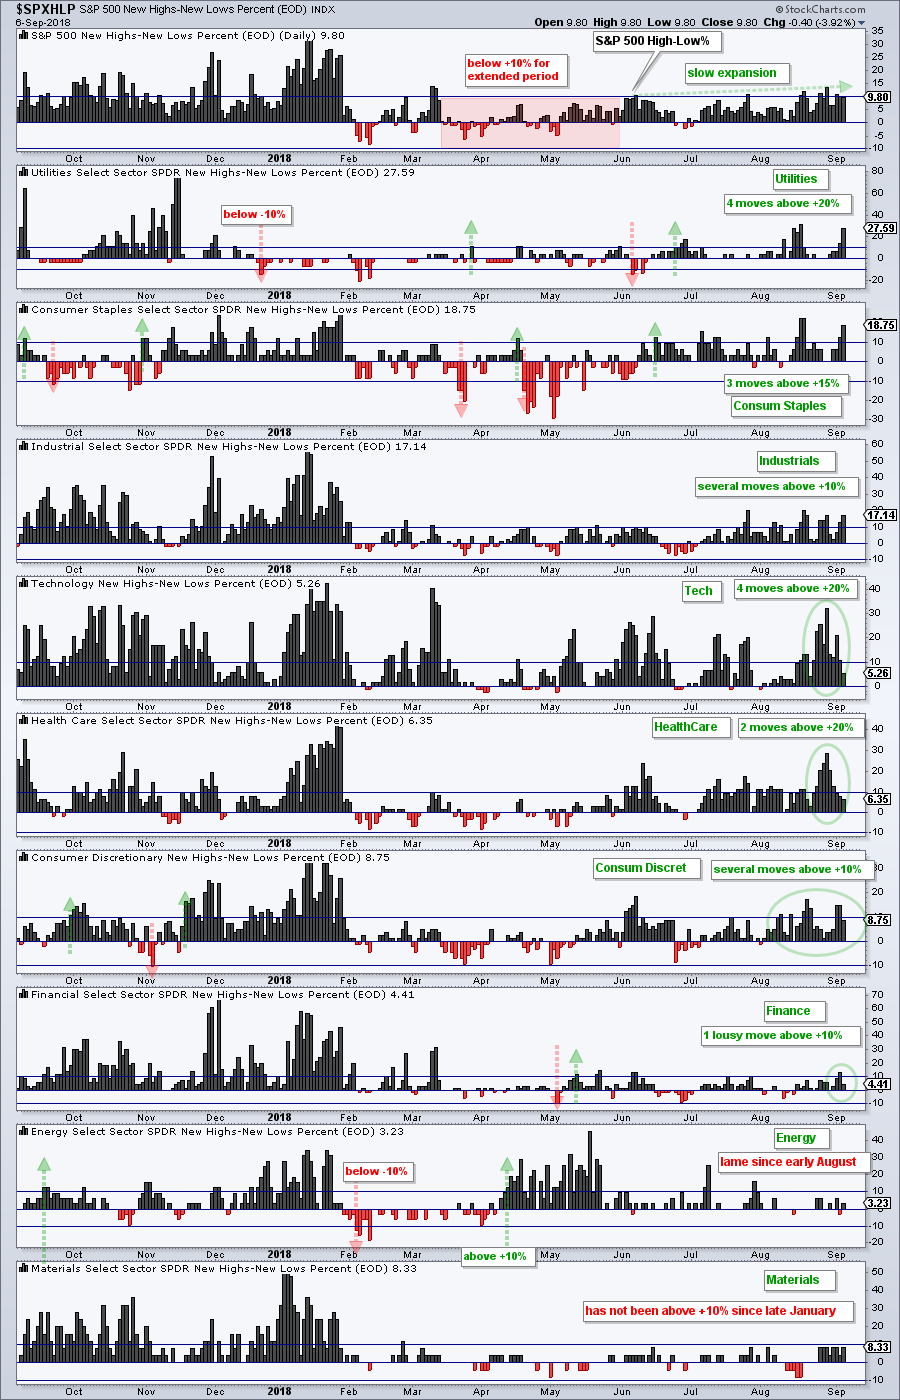
The next chart shows High-Low Percent for the S&P 500 and the nine sectors. Notice that S&P 500 High-Low% ($SPXHLP) has been gradually, ever so gradually, expanding since June. The number of new highs is certainly not overwhelming, but there are clearly more new highs than new lows and this is enough to keep the market afloat.
New highs perked up in utilities and staples over the last four weeks and remained strong for industrials. Notice that XLI High-Low% ($XLIHLP) exceeded +15% several times since late July. Elsewhere, tech, healthcare and consumer discretionary are bullish overall. Finance, energy and materials are the weakest sectors when it comes to new highs.
Notes from the Art's Charts ChartList
- Chart Leaders: HACK, IGV, SKYY, REM, KIE, ITA, IHI, IHF
- Chart Laggards: ITB, IAI, XES, KOL, XME, SLX, COPX, GDX
- The Home Construction iShares (ITB) attempted a small wedge breakout, but fell back immediately as the bigger downtrend exerted itself.
- Cloud Computing ETF (SKYY), Cyber Security ETF (HACK) and Software iShares (IGV) are the strongest tech ETFs overall, but all three pulled back the last few days and could be ripe for a corrective period.
- The Internet ETF (FDN) formed a lower high from July to August and is lagging the other tech ETFs.
- The Broker-Dealer iShares (IAI) reversed its short-term upswing as the bigger downtrend took over.
- The Insurance SPDR (KIE) and Mortgage REIT ETF (REM) remain strong with 52-week highs this week.
- The Regional Bank SPDR (KRE) barely bounced in July and August and shows relative weakness since June.
- The REIT iShares (IYR) is also strong as it consolidated near a 52-week high with a small flag/pennant.
- The Aerospace & Defense iShares (ITA) hit a new high and is leading.
- The Biotech iShares (IBB) and Biotech SPDR (XBI) fell back rather hard the last few days, but record new highs recently and remain in uptrends overall.
- The Medical Devices ETF (IHI) and HealthCare Providers ETF (IHF) remain two of the strongest ETFs overall. The Metals & Mining SPDR (XME) and Steel ETF (SLX) bounced at the end of August, but these were dead-cat bounces as both broke wedge/flag lines this week.
- The Coal ETF (KOL) is testing support from a large head-and-shoulders reversal pattern.
- Click here for the Art's Charts ChartList
Questions, Comments or Feedback?
I cannot promise to response to all correspondence, but I will read it and take into under consideration. I greatly appreciate all feedback because it helps me improve the commentary and provides ideas for the future. Sorry, I do not take symbol requests.

Plan Your Trade and Trade Your Plan.
- Arthur Hill, CMT
Senior Technical Analyst, StockCharts.com
Book: Define the Trend and Trade the Trend
Twitter: Follow @ArthurHill


