- %Above 200-day EMA.
- IJR and MDY Correct as QQQ Breaks Out.
- XLC and XLF are Lagging.
- XLF and Treasury Yields.
- Utes and REITs become Short-term Oversold.
- Big Biotechs are Leading Again.
- JAZZ Hits Reversal Area.
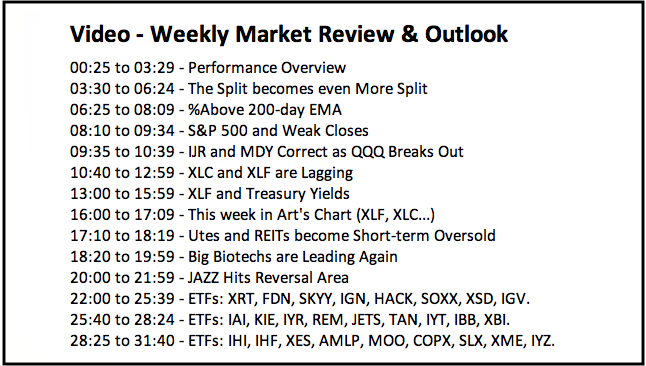
- Notes from the Art's Charts ChartList.
 ...The stock market as a whole remains in bull market mode, but there are some serious splits within the market. Most tech and healthcare related ETFs are still strong and leading the market. The Semiconductor iShares (SOXX) is the exception here. There are pockets of strength in the consumer discretionary sector, such as the Retail SPDR (XRT), and in the industrials sector, such as the Aerospace & Defense iShares (ITA) and Transport iShares (IYT).
These pockets of strength are offset, but not completely, by pockets of weakness. The Finance sector was hit hard this week with the Regional Bank SPDR (KRE) and Broker-Dealer iShares (IAI) breaking their summer lows. The Home Construction iShares (ITB) extended its decline and hit a new low for 2018. Even though we saw oversold bounces in the Metals & Mining SPDR (XME) and Copper Miners ETF (COPX), these two are still more than 10% below their 52-week highs.
These splits, believe it or not, are responsible for the low volatility. It is net bullish when 60% of stocks advance and 40% decline. However, the declines mute the advances and this results in a grind higher, which is what the S&P 500 has done the last four months. I have yet to see enough selling pressure to tilt the balance to the bears, but the number of stocks participating in the uptrend is decreasing and this is becoming a concern to watch going forward.
%Above 200-day EMA
The percentage of stocks above the 200-day EMA is an indicator that measures trend participation. StockCharts calculates and publishes this indicator for the major stock indexes and sectors (click here for the list). This indicator has been above 60% for the S&P 500 since July, but recently moved below 60% for the S&P Small-Cap 600 and S&P Mid-Cap 400 (blue circles). The latter two were above 60% from early May to late September and this coincided with a steady uptrend.
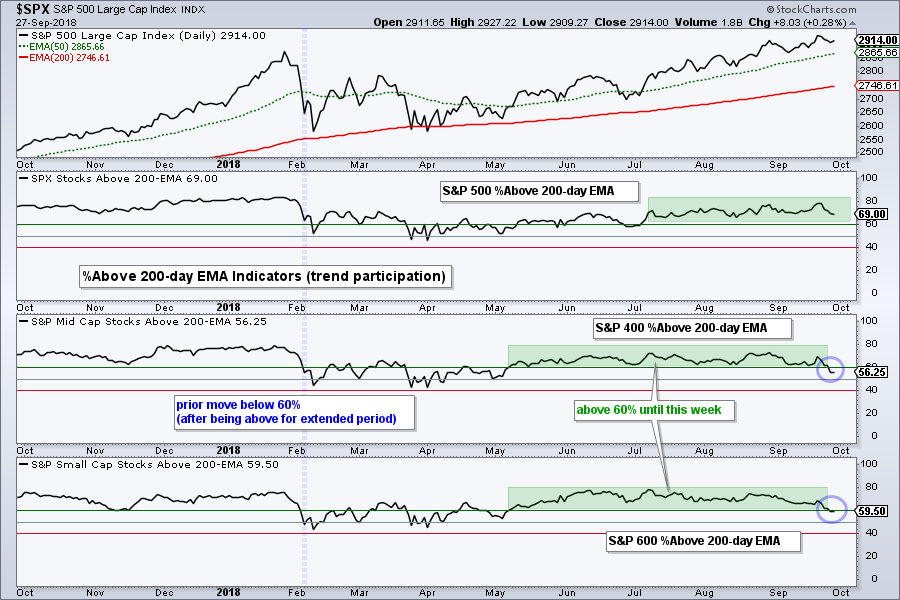
The moves below 60% show that "trend participation" is weakening in small-caps and mid-caps. I would also point out the moves below 60% in early February (blue vertical line). These moves occurred after an extended period above 60% and led to a three to four month period of choppy trading. The S&P 500 is still the 800 pound gorilla in the room here and over 60% of its stocks are above the 200-day EMA (69% to be precise).
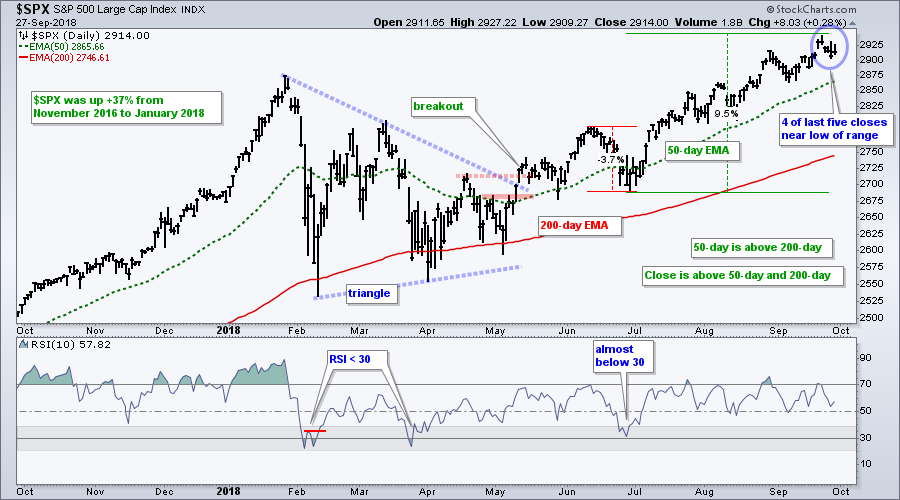
Short-term Selling Pressure in SPX
The S&P 500 hit a new high last week and then edged lower the last four days. Notice that the index closed near the low end of its intraday range for four of the last five days. This shows some intraday selling pressure, but it is still a short-term issue. Keep in mind that the index advanced 9-10 % from late June to mid September and the last decent pullback occurred in June (3-4%). A pullback at this stage, while difficult to predict, would be normal. In fact, a dip below the 50-day EMA would set up a mean-reversion opportunity because the bigger trend is still up.
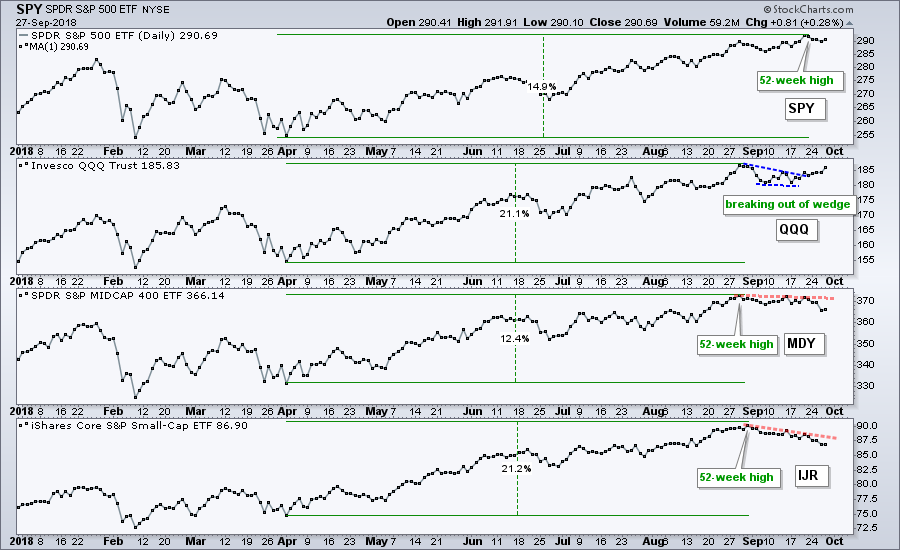
IJR and MDY Correct as QQQ Breaks Out
The next chart shows the big four (SPY, QQQ, IJR and MDY). SPY hit a new high five days ago, while QQQ, IJR and MDY hit new highs in late August. The long-term trends are clearly up, but we can see four week downtrends in IJR and MDY (red lines). These are still deemed corrections because the bigger trend is up. Of note, QQQ performed the best over the last five days and broke out of a small wedge.
XLC and XLF are Lagging
Four of the six big sectors are in uptrends and powering the broader market. The CandleGlance chart below shows these six with the PPO (25,125,0) in the indicator window. This indicator shows the percentage distance between the 25-day EMA and 125-day EMA. All are positive, which means the 25-day EMA is above the 125-day EMA, but two are less positive than the others. The Financials SPDR (XLF) and the Communication Services SPDR (XLC) are the weakest of the big six right now because they have the lowest PPO values (below 2.00 or 2%).
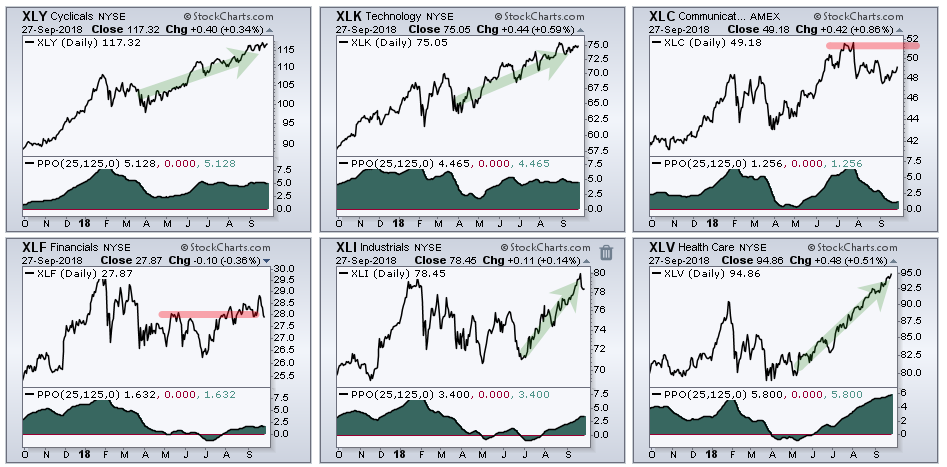
The four sectors with green arrow lines hit new highs in August or September and are in clear long-term uptrends. The two with red lines, XLF and XLC, are lagging. XLF is having trouble staying above its summer highs and remains well below its January high. XLC is well below its summer highs.
Note that I covered XLC, XLK and the top ten stocks in each ETF in On Trend on Tuesday (click here).
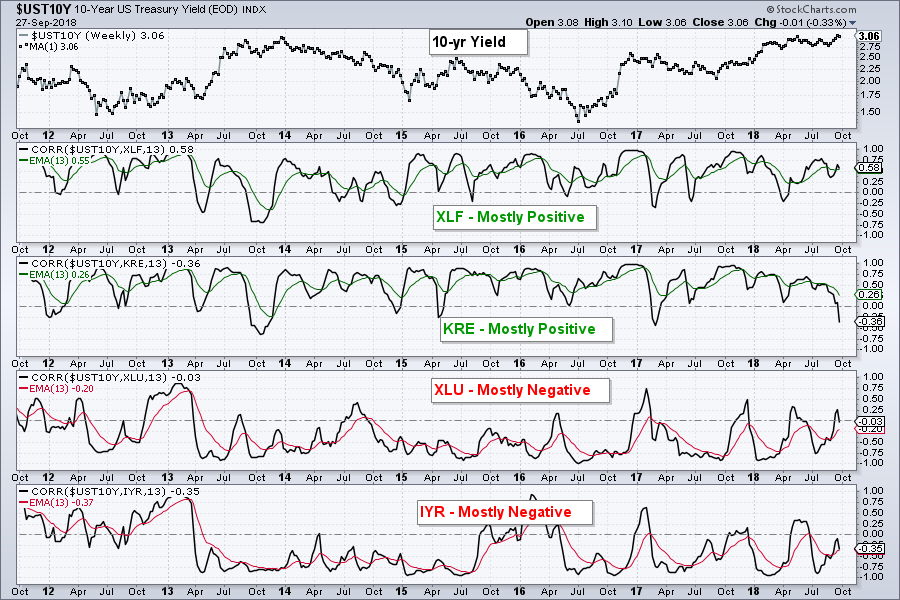
XLF and Treasury Yields
The Financials SPDR (XLF), Regional Bank SPDR (KRE) and Broker-Dealer iShares (IAI) are usually positively correlated to the 10-yr T-Yield ($TNX), but this positive relationship is looking strained. Positive correlation means they tend to rise when the 10-yr yield rises. Conversely, the Utilities SPDR (XLU) and REIT iShares (IYR) are negatively correlated to the 10-yr yield, which means they tend to fall when the 10-yr yield rises.
As interesting as correlations are, I don't think we can base a trading or investing decision on something so far removed from the price of the underlying. Admittedly, I am prone to this trap and must remind myself that there are dozens of other "fundamental" price drivers and the 10-yr yield is just one input.
Most of the time, I learn the true fundamental reason well after the fact. In other words, something else out there is driving prices and we just don’t know it yet. This is why it is best to focus on the price charts for what we are actually trading. We are not trading correlations. We are trading the actual stocks and ETFs.
Note that I covered XLF, KRE and IAI in detail on Thursday.
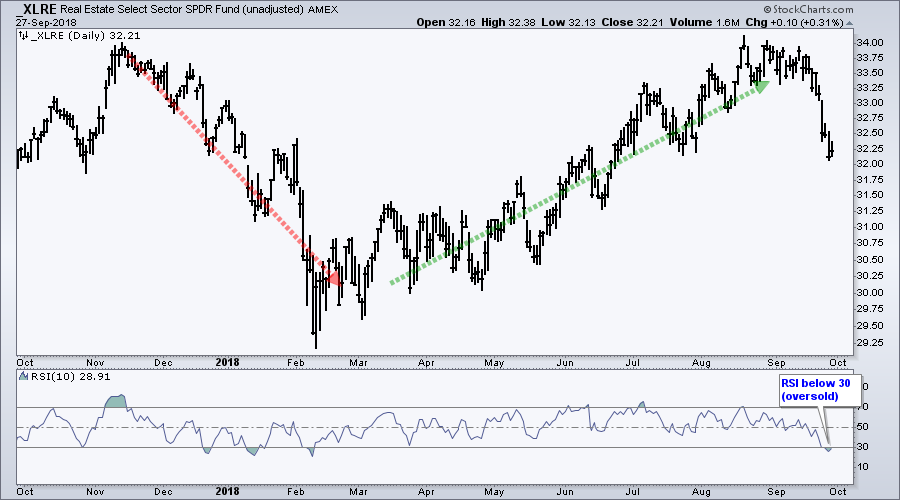
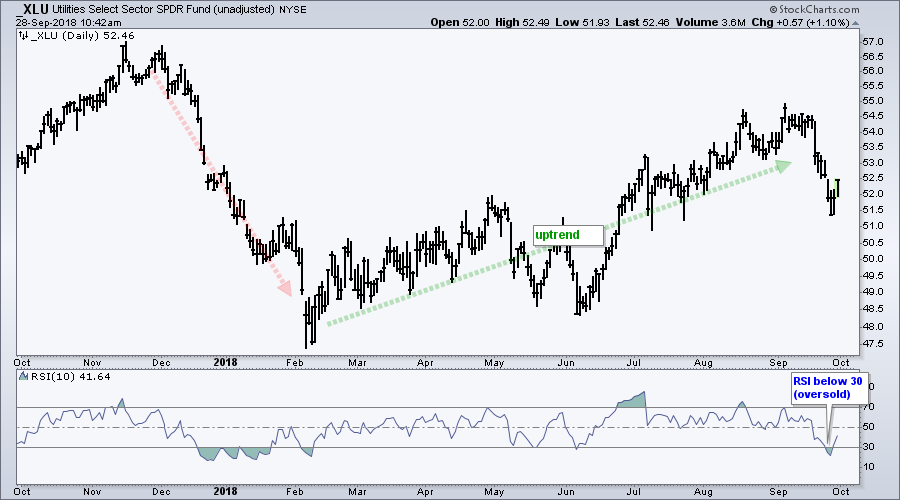
Utes and REITs become Short-term Oversold
The Utilities SPDR (XLU) and the Real Estate SPDR (XLRE) fell sharply over the last two weeks and became short-term oversold. The first chart shows unadjusted XLU with an uptrend from February to September. XLU was a market leader in early September, but fell hard over the last two weeks and became oversold. Though not shown, note that the 50-day EMA is above the 200-day EMA and the 25-day EMA is above the 125-day EMA. This suggests that XLU is short-term oversold in a long-term uptrend and a mean-reversion opportunity is upon us. The second chart shows XLRE with a similar setup.
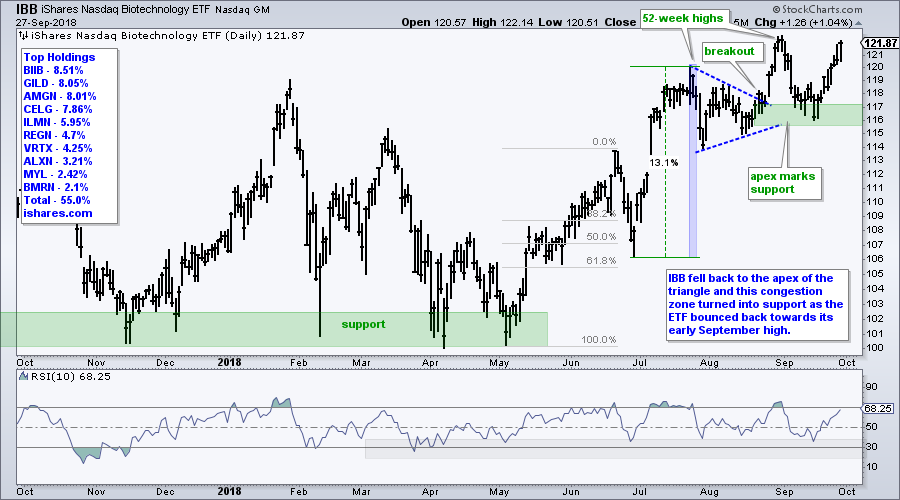
Big Biotechs are Leading Again
The Biotech iShares (IBB) and large biotechs are showing upside leadership as IBB challenges its early September high, which was a 52-week high. Notice how the ETF broke out of a triangle in late August, fell back to the apex and surged off this support zone. ETFs and stocks this close to a fresh new high are leading and should be on our radar.
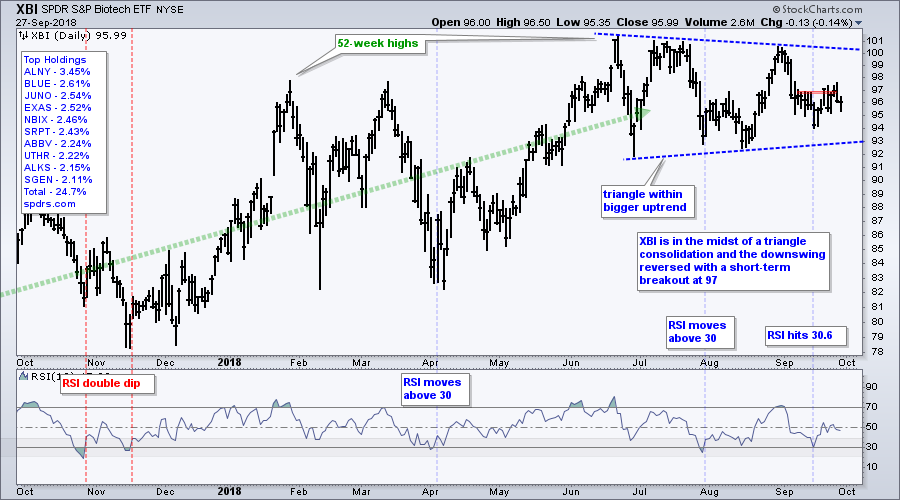
While IBB represents large-cap biotechs, note that the Biotech SPDR (XBI) is a broader ETF that represents the smaller biotechs or the industry group as a whole. XBI is lagging IBB because it formed a lower high in early September and remains below this high. Nevertheless, the long-term trend is up and the triangle looks like a consolidation within this bigger uptrend. XBI is firming above the August low and I would watch for an upside catalyst here.
JAZZ Hits Reversal Area
Among big biotechs, I highlighted Regeneron (REGN) in DITC this week and Gilead (GILD) on September 19th. I also featured Jazz Pharmaceuticals in late August as RSI moved above 30. This setup did not pan out because JAZZ moved below its August low in September, but the overall picture remains unchanged. The long-term trend is up and the decline from June to September looks like a correction.
The chart shows JAZZ hitting a potential reversal zone in mid September. Notice that broken resistance turns support in the 158-160 area and the 38-50% retracement zone is in this area as well. Assuming the bigger uptrend will resume at some point, a two-steps forward and one step backward sequence should end sooner rather than later.
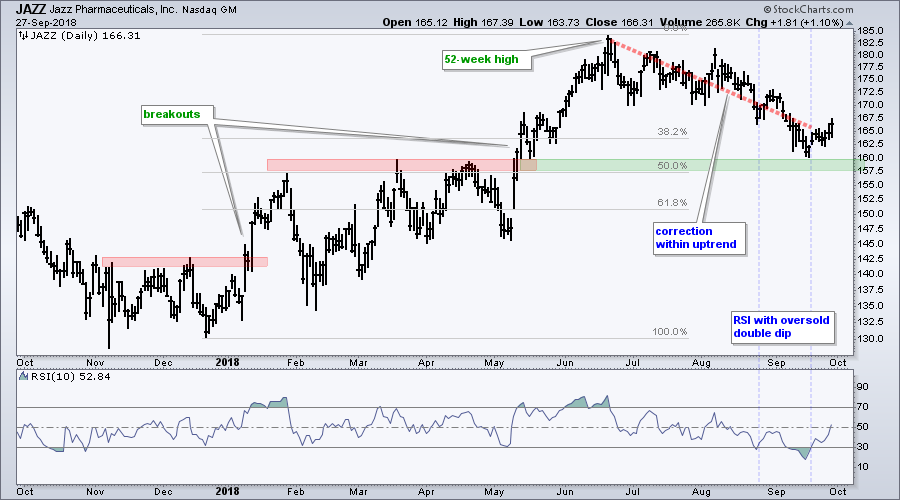
The indicator window shows RSI doing the dreaded double dip as it moves below 30 twice. Ideally, the stock would bounce after the first oversold reading, but the markets are far from ideal. The second dip was quite deep, but RSI moved back above 30 and above 50 (its mid point). This is a positive short-term sign for improving momentum.
Notes from the Art's Charts ChartList
- Chart Leaders: XRT, SKYY, HACK, IGV, IGN, REM, KIE, IYT, ITA, IHI, IHF, MOO
- Chart Laggards: ITB, IAI, KRE, XES, KOL, XME, SLX, COPX, GDX
- Poised for a Bounce?: AMJ, IYR, REM, FDN, HACK, IGN, XBI
- Bulls Flags (but Long-term downtrends): XME, COPX
- The Cloud Computing ETF (SKYY) is leading the tech-related ETFs with a triangle breakout this week.
- The Cyber Security ETF (HACK) is consolidating above its breakout zone.
- The Internet ETF (FDN) is going for a wedge breakout.
- The Software iShares (IGV) remains in a steady uptrend.
- The Mortgage REIT ETF (REM) and Transport iShares (IYT) fell back after 52-week highs and could be poised for mean-reversion bounces.
- The Aerospace & Defense iShares (ITA) continues to show upside leadership.
- The Biotech iShares (IBB) surged off support and is near its early September high.
- The HealthCare Providers ETF (IHF) and Medical Devices ETF (IHI) continue to lead with new highs.
- The Alerian MLP ETF (AMJ) corrected after a 52-week high and RSI became oversold this week.
- The Copper Miners ETF (COPX) and Metals & Mining SPDR (XME) are both in long-term downtrends, but surged in September and formed bull flags with this week's pullback.
- The Oil & Gas E&P SPDR (XOP) broke out and looks stronger than the Oil & Gas Equip & Services SPDR (XES) overall.
- Click here for the Art's Charts ChartList
Questions, Comments or Feedback?
I do not take symbol request and I cannot promise to response to all correspondence, but I will read it and take into under consideration. I greatly appreciate all feedback because it helps me improve the commentary and provides ideas for the future.

Plan Your Trade and Trade Your Plan.
- Arthur Hill, CMT
Senior Technical Analyst, StockCharts.com
Book: Define the Trend and Trade the Trend
Twitter: Follow @ArthurHill


