- Small-caps Become More Oversold.
- XLE Ends Another Long Correction.
- XES Forms Another Higher Low.
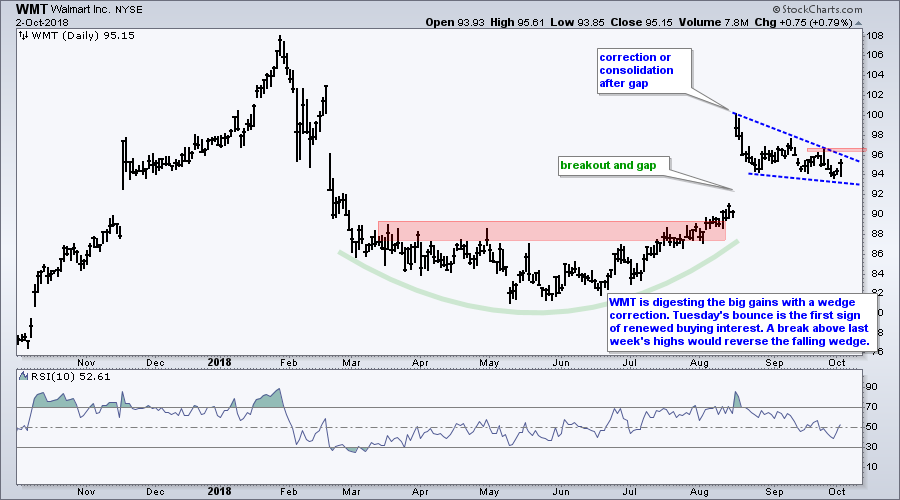
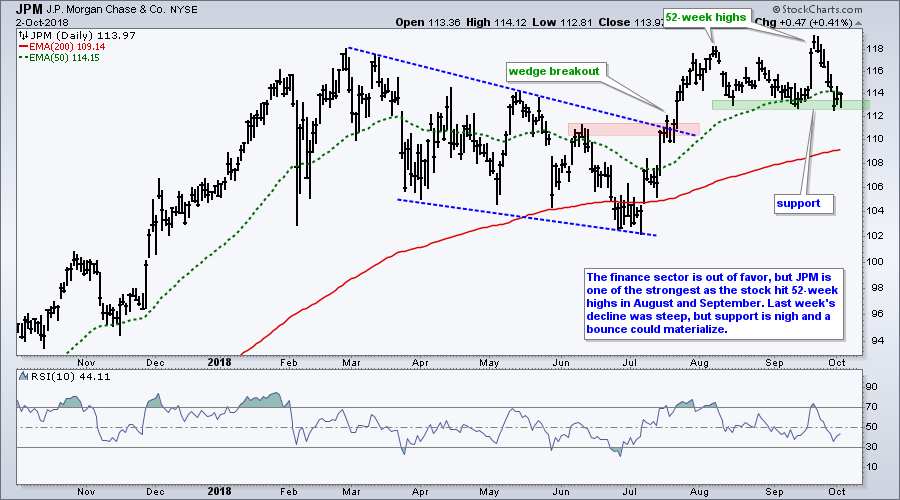
- Stocks to Watch: VZ, NOV, PSX, VLO, WMT, JPM.
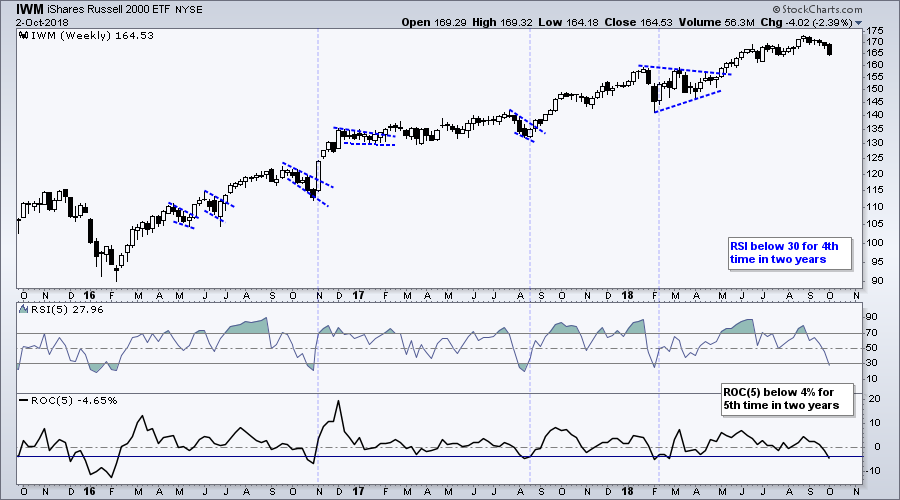
 ... Small-caps are leading the market lower as the S&P SmallCap iShares (IJR) and Russell 2000 iShares (IWM) fell over 4% in the last five weeks. These declines certainly look ugly on the daily charts, but these declines are still relatively minor on the weekly charts and the long-term trends are still up.
When looking at a price chart, the first question I ask is: what is the direction of the bigger trend? The answer to this question then sets my trading bias, which is bullish or bearish. The long-term trend for IJR is clearly up because the ETF recorded a 52-week high in late August, a mere six weeks ago. The moving averages are not shown, but the 10-week is above the 40-week and price is well above the rising 40-week.
My trading bias is bullish because the long-term trend is clearly up. Thus, I am looking for bullish patterns and mean-reversion setups. The daily setups I pointed out over the last two weeks did not work out, but we now have a weekly mean-reversion setup brewing. We are still in a bull market and I still expect small-caps to bounce.
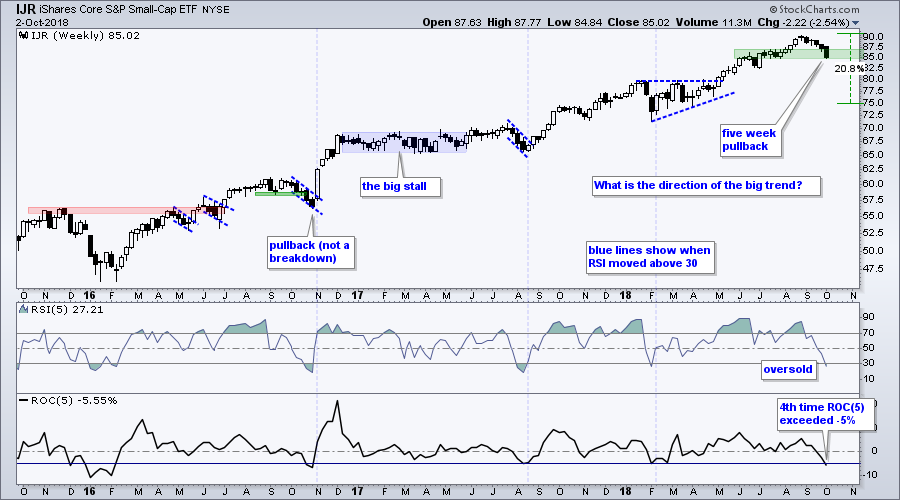
The indicator windows shows RSI(5) and the 5-week Rate-of-Change. Notice that this is the fourth time in two years that the Rate-of-Change exceeded 5%. Also note that each time the Rate-of-Change dipped below -5%, RSI(5) dipped below 30. Thus, this 5.55% decline created a short-term oversold condition and a mean-reversion setup. Look for RSI to move back above 30 for a bullish signal.
XLE Ends Another Long Correction
The Energy SPDR (XLE) chart provides two lessons in patience and price analysis. First, the ETF advanced over 50% in 2016 with two big steps forward. The ETF then corrected with one very long step backward. This was an eight month decline, but it was still a correction after the big advance because it retraced around 50% of this advance.
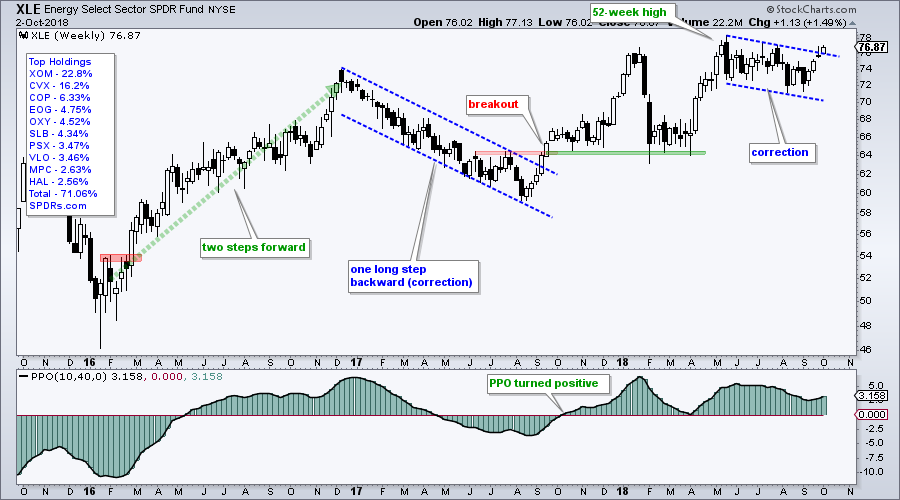
Fast forward to now and we can see a 20% advance to new highs in April-May and then a long step back with the correction into August. XLE led the market higher in September with a 2.5% advance and broke out of the falling channel. The bigger trend is up and this signals a continuation of that uptrend.
XES Forms another Higher Low
The Oil & Gas Equip & Services SPDR (XES) has been one wild ride over the last few years. After plunging over 70% from June 2014 to January 2016, the ETF bounced with a 97% advance. This was followed by a 48% decline and test of the 2016 lows in August 2017. Trading has remained volatile the last 15 months, but there are some bullish developments recently.
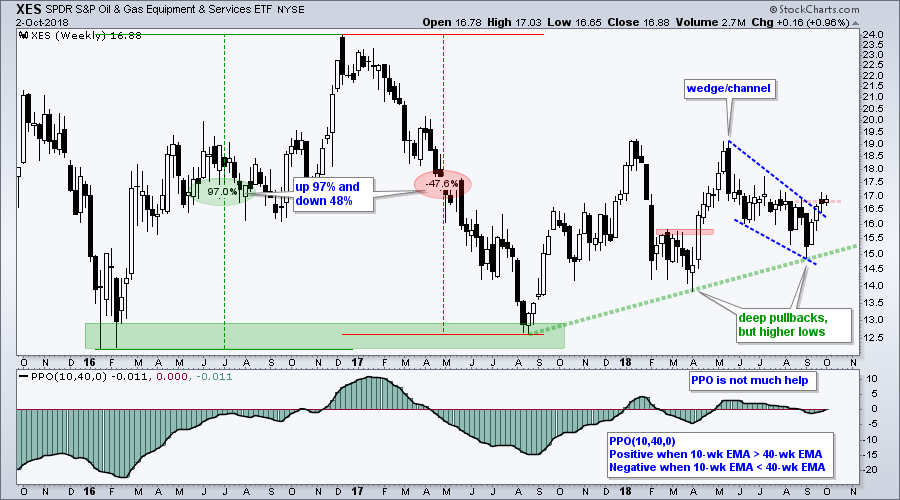
The pullbacks in 2018 were quite deep, but XES managed to form higher lows in April 2018 and August 2018. These rising lows show buying pressure coming in at higher prices and this is bullish. Second, the ETF formed a channel or wedge into August and broke the upper line with a surge over the last four weeks. This breakout signals an end to the pullback and reverses the immediate downtrend.
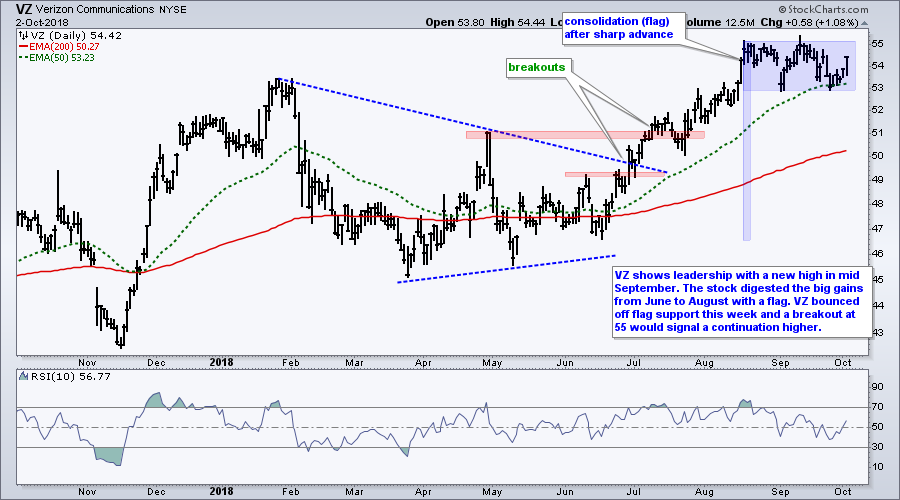
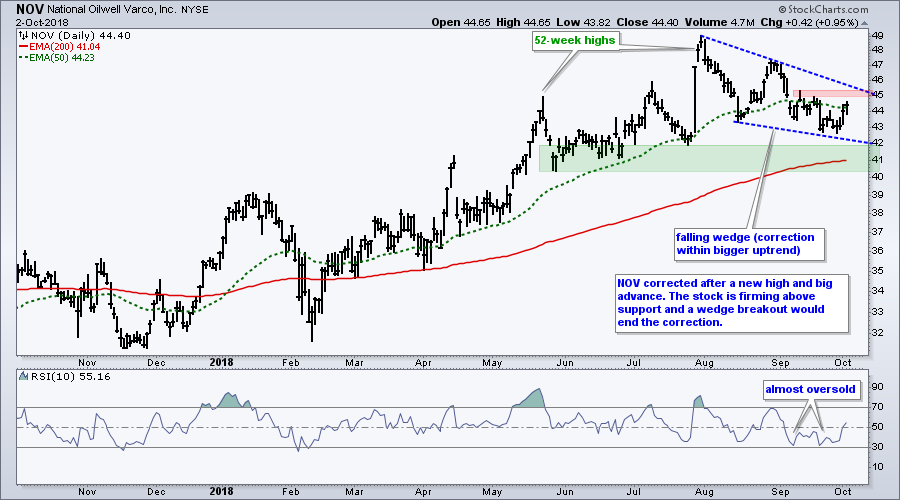
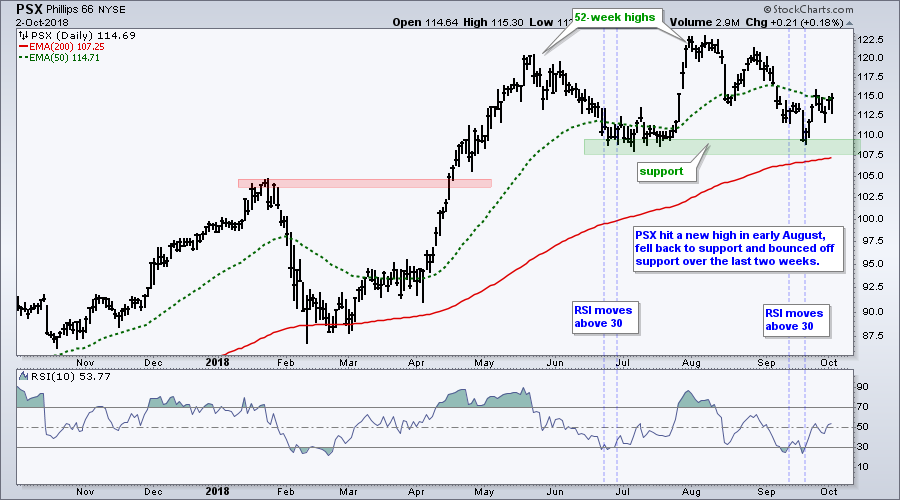
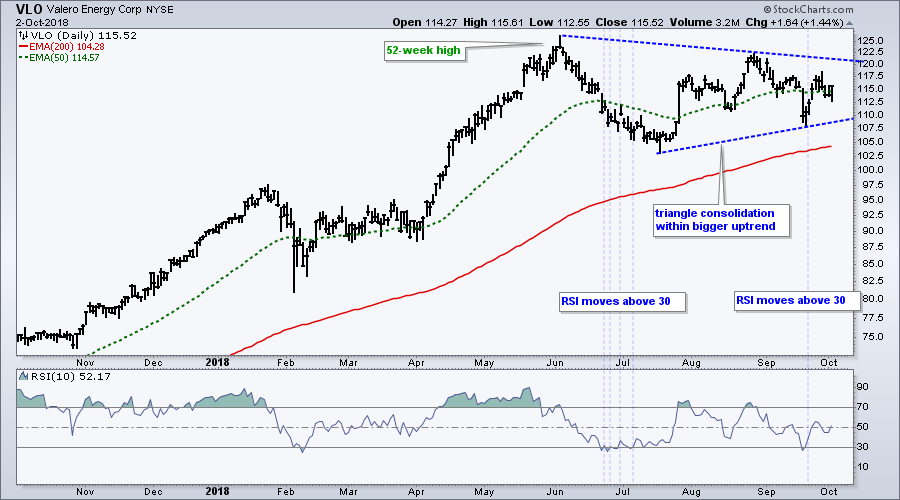
Stocks to Watch: VZ, NOV, PSX, VLO, WMT, JPM
On Trend on Youtube
Available to everyone, On Trend with Arthur Hill airs Tuesdays at 10:30AM ET on StockCharts TV and repeats throughout the week at the same time. Each show is then archived on our Youtube channel.
Topics for Tuesday, October 2nd:
- Keeping Perspective (SPY, QQQ, MDY, IJR)
- Higher Yields and Rising Energy Prices (plus UUP)
- Market Drags (XLF, XLC, IAI, ITB, KRE)
- Focus on Energy-Related ETFs (XLE, XES, XOP, FRAK)
- #AskArthur: ETFs vs Indexes, ChartLists, Funnymentals
- Stocks to Watch: NOV, OKE, ORCL, OXY, PSX VZ
- Click here to Watch
Questions, Comments or Feedback?
I cannot promise to response to all correspondence, but I will read it and take into under consideration. I greatly appreciate all feedback because it helps me improve the commentary and provides ideas for the future. Sorry, I do not take symbol requests.

Plan Your Trade and Trade Your Plan.
- Arthur Hill, CMT
Senior Technical Analyst, StockCharts.com
Book: Define the Trend and Trade the Trend
Twitter: Follow @ArthurHill


