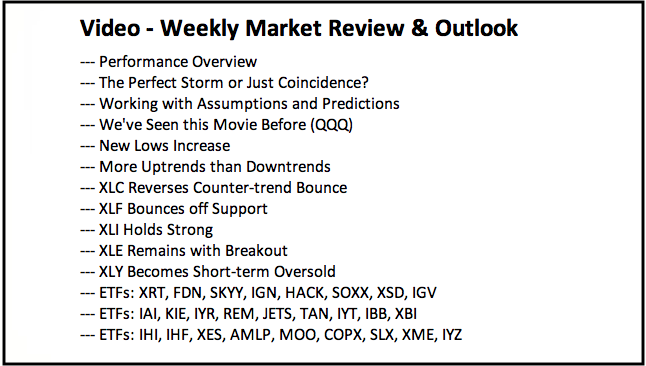
- Performance Overview.
- The Perfect Storm or Just Coincidence?
- Working with Assumptions and Predictions.
- We've Seen this Movie Before (QQQ).
- New Lows Increase.
- More Uptrends than Downtrends.
- XLC Reverses Counter-trend Bounce.
- XLF Bounces off Support.
- XLI Holds Strong.
- XLE Remains with Breakout.
- XLY Becomes Short-term Oversold.
- Notes from the Art's Charts ChartList.
 ... The Perfect Storm or Just Coincidence?
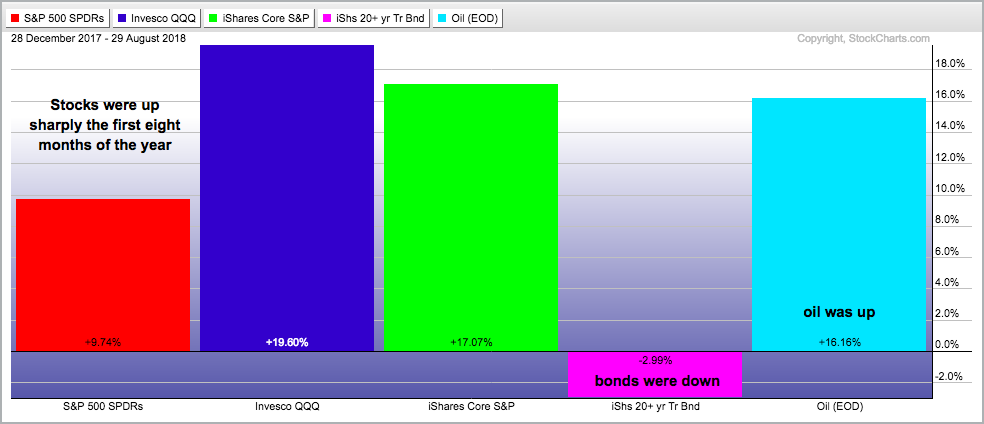
... Let's flash back to late August, a happier time for the stock market. Year-to-date, the S&P 500 SPDR was up 10%, the Nasdaq 100 ETF was up 19% and the S&P SmallCap iShares was up 17%. A pretty good year was unfolding with double digit gains over an 8 month timeframe. The 20+ YR T-Bond ETF was down 3% and the oil was up 16%.
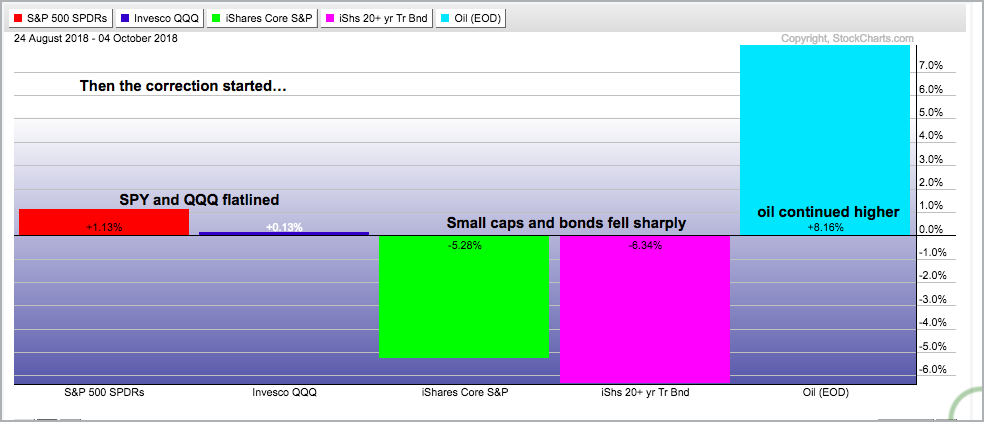
Flash forward to early October and the picture has changed somewhat. The 20+ YR T-Bond ETF peaked on August 24th and the S&P SmallCap iShares peaked on August 27th. Both fell sharply with 5+ percent declines over the last six weeks. SPY is up a fraction, QQQ is flat and oil is up another 8%.
Small-caps are clearly in the midst of a correction, as are mid-caps. Chartists looking for fundamental reasons can point to the surge in Treasury yields as the 10-yr T-Yield hit a seven year high. We could also blame rising oil prices, a hawkish Fed and rising wages. Perhaps all four combined for the perfect storm. Did someone say “October”?
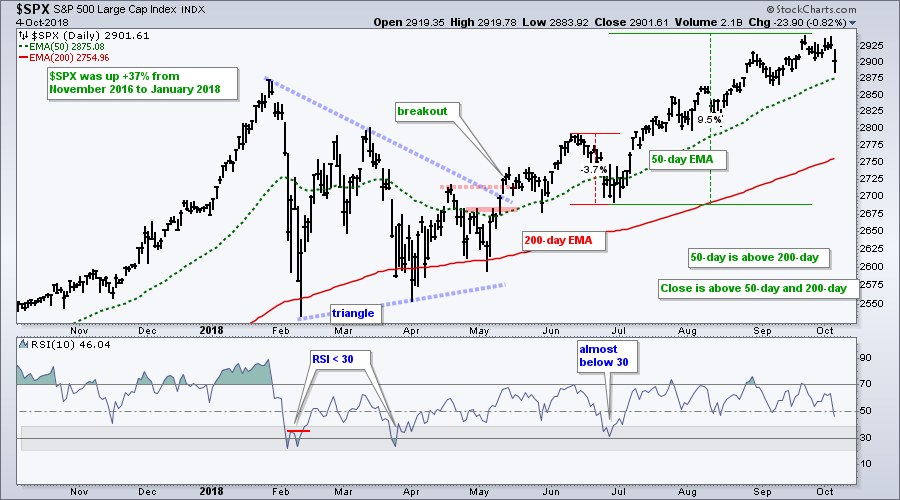
Or.....perhaps stocks were just extended and ripe for a correction, which is a normal part of the process. The S&P 500 was up around 13% from the May low to the September high (four months) and up around 9% from the July low to the September high. The index hit new highs in August and September, and has been above the rising 50-day EMA since early July (65 days). A pullback or correction at this stage would be pretty normal. Even a correction to the .... gasp .... 2800 level would be pretty normal.
Working with Assumptions and Predictions
As chartists and traders, we have to make some assumptions. I assume the long-term trend is up when I see recent 52-week highs, the 50-day EMA above the 200-day EMA and price above the rising 200-day EMA. Assuming an uptrend, I further assume that a price decline is just a correction within the bigger uptrend. This means corrections or pullbacks within a bigger uptrend are viewed as opportunities, not threats. Sure, one of these corrections will evolve into a bigger trend reversal, but trend tend to continue more often than they reversal.
Now comes the hard part. How can we estimate the depth of a correction? There is no set answer because not all corrections or pullbacks are the same. Some are short and sharp, while others can be deeper and more extended. Chartists can use broken resistance levels, price lows and the Fibonacci Retracements Tool to estimate the depth of a correction.
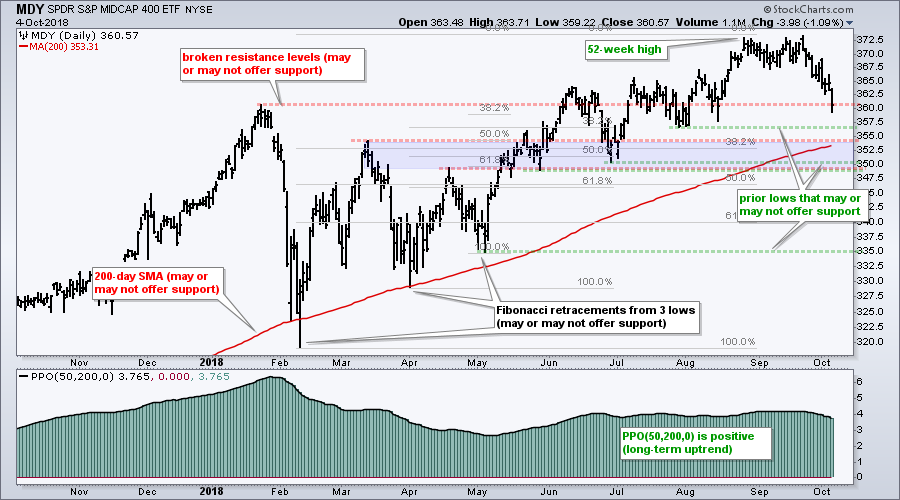
The chart below shows the S&P MidCap SPDR (MDY) with the red lines marking broken resistance levels, the green lines marking troughs and the gray lines marking the Fibonacci Retracements. Truth be told, any one of these lines could mark the exact support level or end of the correction. Only hindsight will tell!
Chartists can also look for a confluence of levels and pick a zone, such as the blue zone in the 348-353 area. Or, we could simply remove all these lines and just point out the rising 200-day SMA as support, which held in February and early April. You get the idea. Predicting support is a guesstimate and the 350-355 area is my best guess.
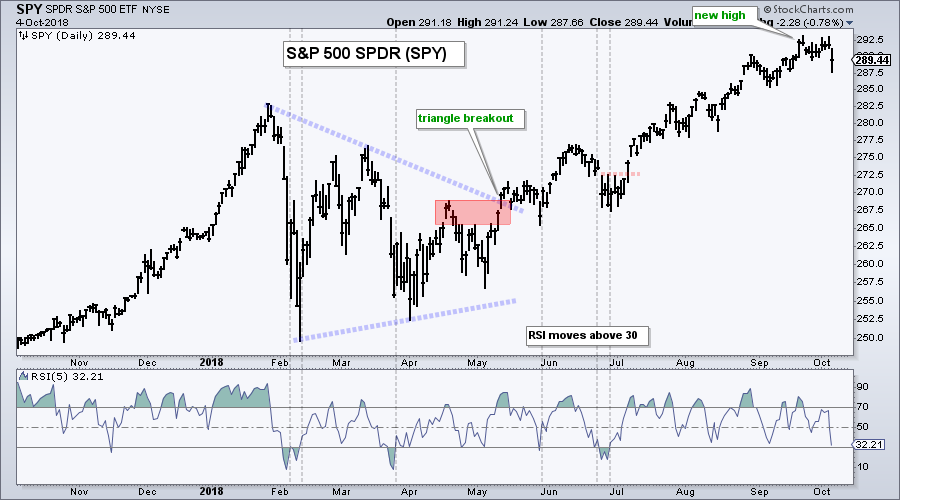
The next chart shows the S&P 500 SPDR (SPY) falling sharply on Thursday. The ETF is still less than 2% from a 52-week high, which it recorded in late September. This is hardly a correction, much less a pullback. It is more like a one-day decline or two week trading range.
Weakness in small-caps and mid-caps is a concern, but the S&P 500 is holding up just fine and this index is the 800-pound gorilla in the room. This index accounts for some 80% of the total investable equity market and the bull market will not end until the gorilla sings.
We've Seen this Movie Before (QQQ)
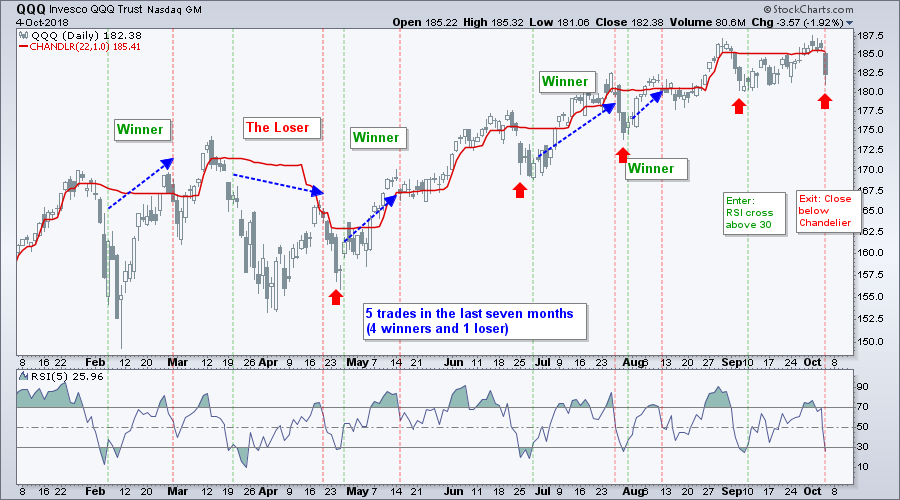
The Nasdaq 100 ETF (QQQ) fell over 2% the last three days and this is the fifth such decline since the early April low (red arrows). The prior declines pushed RSI(5) below 30 and mean-reversion signals triggered a day or two later (green lines). RSI moved below 30 on Thursday for a mean-reversion setup that would trigger with a move above 30.
I never know which signals will be winners and which will be losers. QQQ dropped after the February signal, but rebounded for a winning trade (exit on close below Chandelier). QQQ also dropped further after the mid March signal and did not rebound until April. This trade was a loser.
New Lows Increase
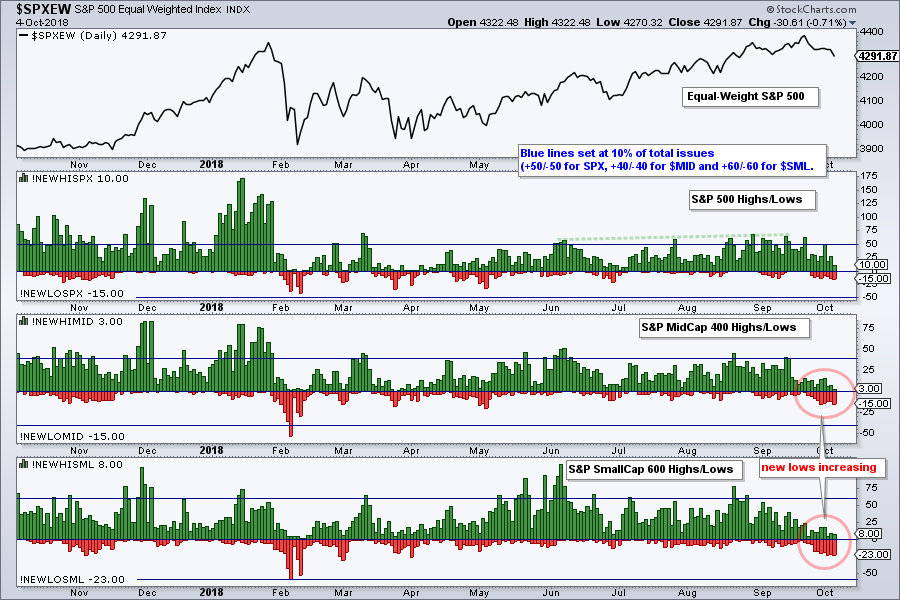
The next chart shows new highs and new lows for the S&P 500, S&P Mid-Cap 400 and S&P Small-Cap 600. There were 15 new lows in the S&P 500 on Thursday, 15 in the S&P Mid-Cap 400 and 23 in the S&P Small-Cap 600. Notice that new lows have been outpacing new highs in the S&P Small-Cap 600 and S&P Mid-Cap 400 over the last two weeks. This is not a good sign, but I have yet to see a big enough expansion of new lows to become outright bearish. The trouble starts when new lows exceed the 10% thresholds (50 for the S&P 500, 40 for the S&P Mid-Cap 400 and 60 for the S&P Small-Cap 600).
More Uptrends than Downtrends
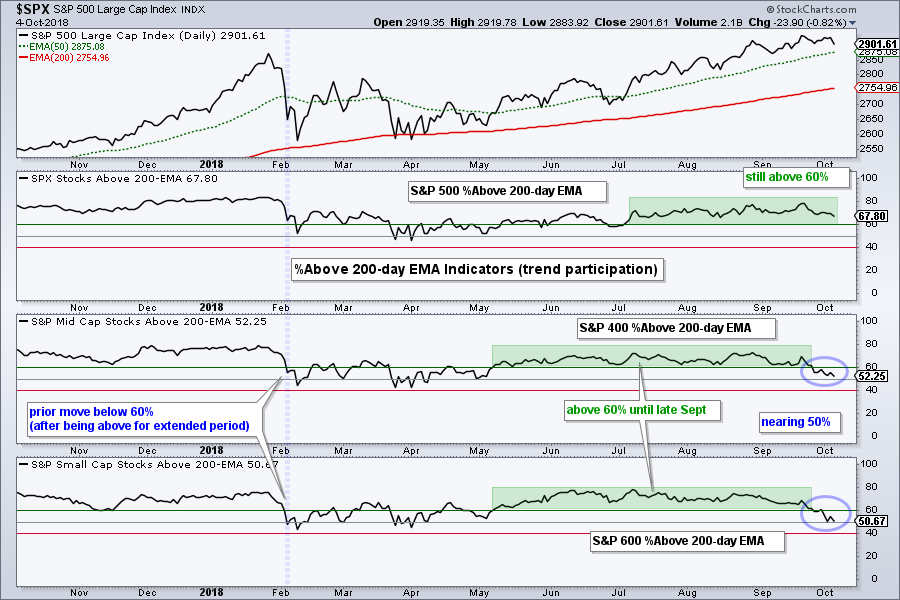
The percentage of stocks above the 200-day EMA reflects a divided market, but there are still more uptrends than downtrends. Notice that 68% of stocks in the S&P 500 are above their 200-day EMAs (32% are below). The numbers are closer to 50% for the S&P Mid-Cap 400 and S&P Small-Cap 600, and this is where the bigger divisions reside. A move below 60% in S&P 500 %Above 200-day EMA (!GT200SPX) would show further weakening and this would be negative.
XLC Reverses Counter-trend Bounce
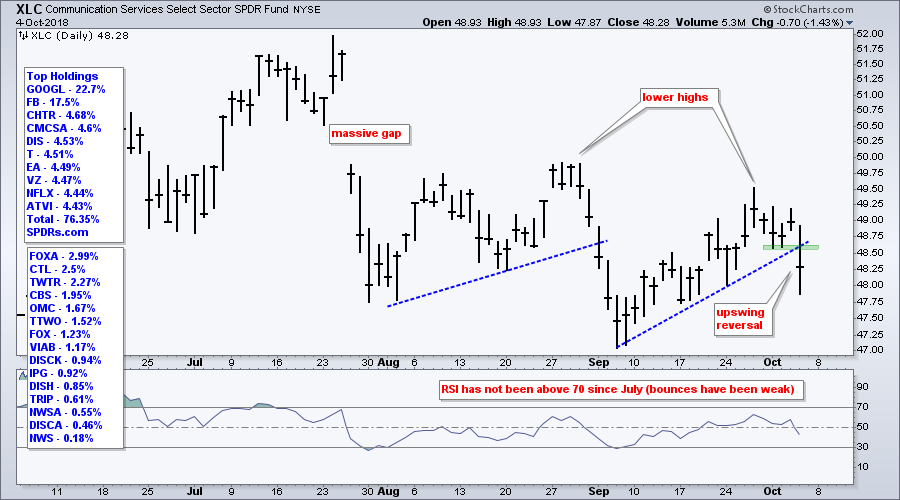
The Communication Services SPDR (XLC) reversed its upswing with a break below the Monday-Tuesday lows and September trend line. Notice that RSI has not been above 70 since July, which reflects the weakness of the counter-trend bounces.
XLF Bounces off Support
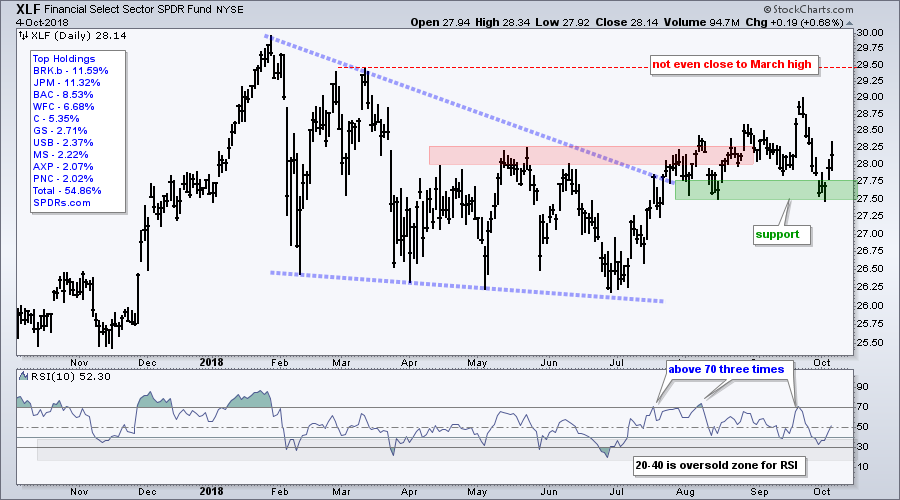
This is classic! The broader market gets hit and the lagging sector bounces. The Consumer Discretionary SPDR (XLY) led the way lower this week with a 3.5% decline. The Technology SPDR (XLK) and Communication Services SPDR (XLC) were also weak and fell over 1%. The Financials SPDR (XLF), which is the only sector that has yet to exceed its March highs, bounced with a 2% gain the last four days.
The chart below shows XLF bouncing off a support zone to keep the three month upswing alive. Not sure how much I trust this bounce and there are still stronger sectors out there (XLY, XLF, XLI, XLV). Note, however, that RSI exceeded 70 three times and this shows strong momentum surges in July, August and September. Thus, the bulls get the benefit of the doubt as long as support at 27.50 holds.
XLI Holds Strong
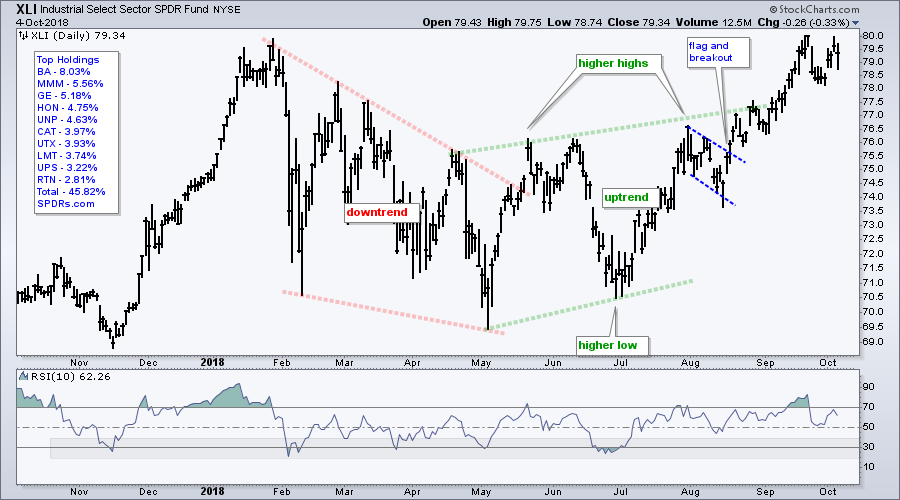
Led by a new high in the Aerospace & Defense iShares (ITA) this week, the Industrials SPDR (XLI) bounced on Monday, Tuesday and Wednesday, and remains above the Monday gap. The ETF is still short-term extended, but the big trend is up and XLI shows price leadership.
XLE Remains with Breakout
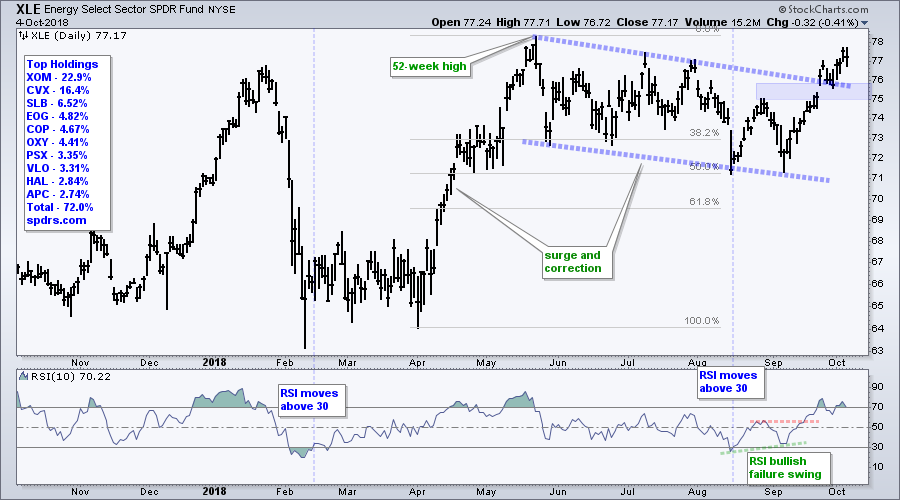
I focused on energy stocks in Tuesday's show, On Trend, and I also covered them in Wednesday's commentary. The chart shows XLE surging in April-May, retracing half with a decline into August-September and breaking out in late September. Even though XLE is short-term extended, the breakout is bullish and I would expect higher prices in the coming weeks or months. The breakout zone in the 75-76 area marks first support to watch on a throwback.
XLY Becomes Short-term Oversold
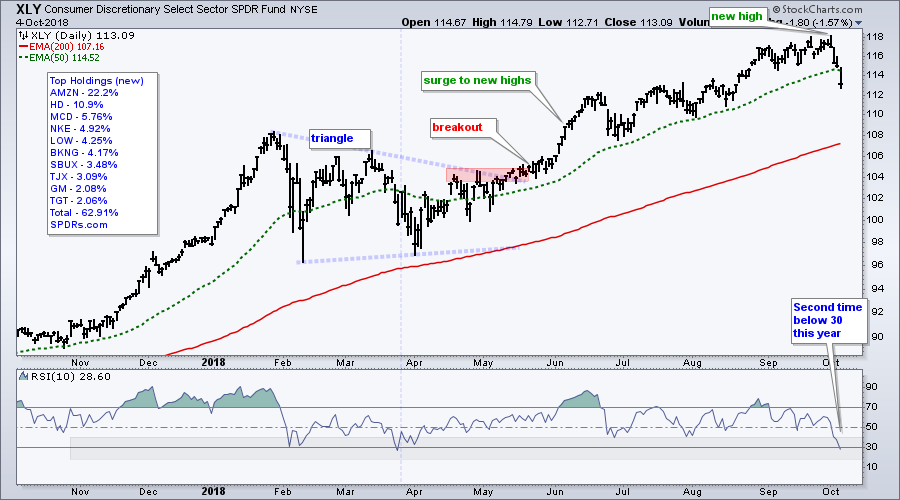
The Consumer Discretionary SPDR (XLY) led the decline in the stock market this week, but the ETF is still in a long-term uptrend and RSI moved below 30. This means we have a short-term oversold condition and mean-reversion setup brewing.
Notes from the Art's Charts ChartList
- Chart Leaders: SKYY, HACK, IGV, KIE, ITA, IYT, IHI, IHF, MOO, IYZ
- Chart Laggards: SOXX, ITB, IAI, KRE, XBI, JETS, KOL, XME, SLX, COPX, GDX
- Short-term Oversold: XRT, HACK, REM, IYR
- Attempting a Reversal: XES, AMJ
- The Retail SPDR (XRT) is in a long-term uptrend and short-term oversold as RSI dipped below 30.
- The Cloud Computing ETF (SKYY) and Cyber Security ETF (HACK) are still in long-term uptrends and RSI is nearing 30 for both (getting short-term oversold).
- The Software iShares (IGV) and Semiconductor SPDR (XSD) fell the last few weeks and have yet to become short-term oversold (RSI(10) < 30).
- The Aerospace & Defense iShares (ITA) is a market leader with a 52-week high this week.
- The Airline ETF (JETS) broke upswing support and reversed its uptrend.
- The Transport iShares (IYT) fell back with a small wedge that looks like a correction after a sharp advance.
- The Biotech iShares (IBB) is back near the support zone, but the Biotech SPDR (XBI) broke the summer lows and reversed its uptrend.
- The Oil & Gas Equip & Services SPDR (XES) broke out of a falling wedge.
- The Alerian MLP ETF (AMJ) surged to resistance from a small falling channel.
- The Telecom iShares (IYZ) continues to hold up well and show chart leadership.
- Click here for the Art's Charts ChartList
Questions, Comments or Feedback?
I do not take symbol request and I cannot promise to response to all correspondence, but I will read it and take into under consideration. I greatly appreciate all feedback because it helps me improve the commentary and provides ideas for the future.

Plan Your Trade and Trade Your Plan.
- Arthur Hill, CMT
Senior Technical Analyst, StockCharts.com
Book: Define the Trend and Trade the Trend
Twitter: Follow @ArthurHill

