- A Self-Fulfilling Prophecy?
- Ranges Wreak Havoc on Moving Average Systems.
- Backtesting Five Indexes.
- More Whipsaws than Strong Trends.
- Other Uses for the 200-day SMA...
 ... The S&P 500 broke its 200-day SMA with a sharp decline last Thursday and then rebounded over the last three days to reclaim this hallowed level. Can we now sound the all clear? Before looking into the evidence, let's review the history of the 200-day SMA for the S&P 500 and some key indexes.
Personally, I do not think the 200-day SMA holds any special power as a support or resistance level, except maybe for the S&P 500. It does not work well with the Dow Industrials, the Russell 2000 or most stocks. It does, however, seem to work well with the S&P 500. Perhaps it has become a self-fulfilling prophecy because so many people follow the S&P 500 and this particular moving average.
Ranges Wreak Havoc on Moving Average Systems
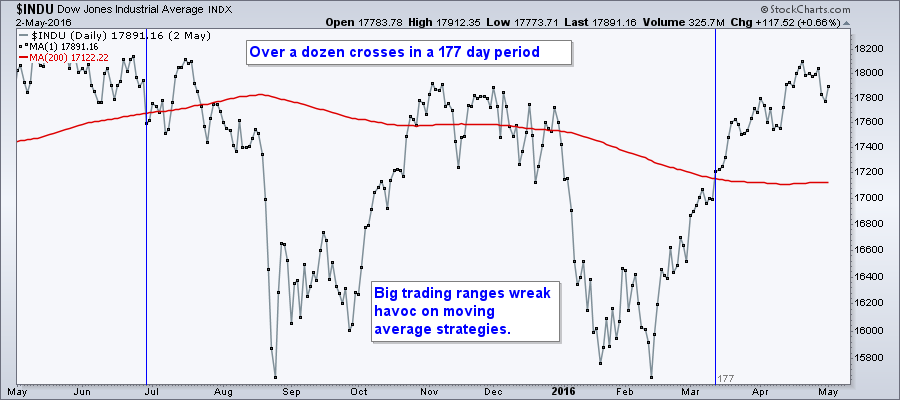
Keep in mind that moving averages are trend following indicators that work best when indexes trend for extended periods. The chart below shows the Dow Industrials from May 2015 to May 2016. The Average traded between 15500 and 18200 during this period and crossed the 200-day SMA over a dozen times. Trading ranges are not the friend of moving averages.
Backtesting Five Indexes
The table below shows backtest results using crosses of the 200-day SMA for signals in the S&P 500, Dow Industrials, Russell 2000, Nasdaq Composite and NYSE Composite. This is a long-only test from January 1994 to October 2018. The Compound Annual Return ranges from 4.3% for the Russell 2000 to 8.74% for the Nasdaq. The Maximum Drawdowns range from -28.51% for the S&P 500 to -49.86% for the Nasdaq. Yes, that higher return comes at the expense of a big drawdown.
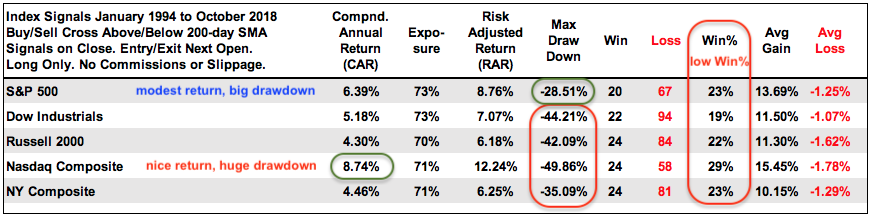
Further along the table, we can see that there are more losing trades than winning trades with the Win% averaging 23%. Nevertheless, the Average Gain is much higher than the Average Loss. I suspect that most losses were whipsaws because most signals lasted less than a week.
More Whipsaws than Strong Trends
Since January 1994, 24 years and 9 months, the S&P 500 crossed its 200-day SMA 176 times (87 crosses above and 88 crosses below). This amounts to around 7 times per year. The index has now crossed the 200-day six times this year with the last four crosses occurring over the last four trading days. 102 of these crosses, more than half, lasted a week or less, which means there were plenty of whipsaw signals.
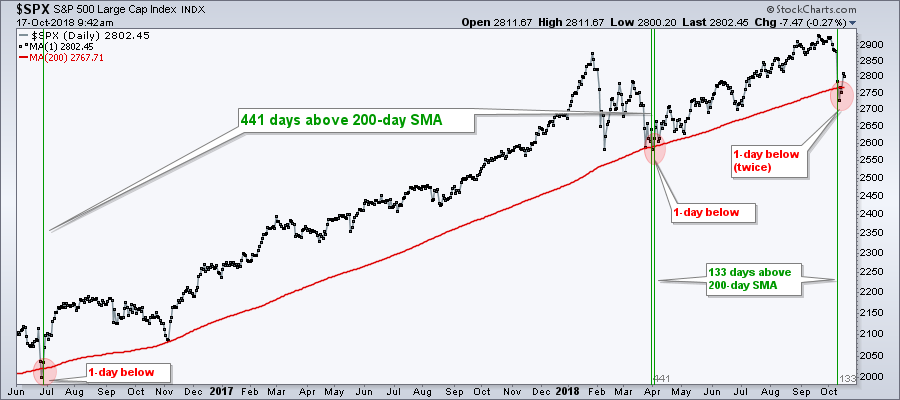 18 of the 87 bullish crosses, 20% of the signals, lasted 100 trading days or longer. The longest uptrend was 524 days from 31-July-1996 to 27-August-1998 (+64%). Most recently, the index was above its 200-day SMA for 441 trading days from 28-June-2016 to 28-March-2018 and gained 27%. The index was above the 200-day for 133 days from 3-April-2018 to 10-October-2018 and gained 7%.
Other Uses for the 200-day SMA
The 200-day SMA for the S&P 500 is not just a trend indicator. It can also be used to measure the risk environment. The details are in this paper from Charlie Bilello and Michael Gayed: Leverage for the Long Run: A Systematic Approach to Managing Risk and Magnifying Returns in Stocks. Also check out their blog (here).
Adding some sort of signal filter is the obvious way to reduce whipsaws. I will post another System Trader article tomorrow. This will test moving average combinations and a standard deviation filter.
On Trend on Youtube
Available to everyone, On Trend with Arthur Hill airs Tuesdays at 10:30AM ET on StockCharts TV and repeats throughout the week at the same time. Each show is then archived on our Youtube channel.
Topics for Tuesday, October 16th:
- Volatility Increases when Below 200-day (Risk On/Off)
- Don't Estimate Depth or Duration (Dow Theory)
- Scanning for Above/Below 200-day (Weight of Evidence)
- The Game Changer for Tech (SOXX, XSD)
- Commodity Review (Gold, Oil, Palladium)
- Click here to Watch
Questions, Comments or Feedback?
I cannot promise to response to all correspondence, but I will read it and take into under consideration. I greatly appreciate all feedback because it helps me improve the commentary and provides ideas for the future. Sorry, I do not take symbol requests.

Plan Your Trade and Trade Your Plan.
- Arthur Hill, CMT
Senior Technical Analyst, StockCharts.com
Book: Define the Trend and Trade the Trend
Twitter: Follow @ArthurHill


