- Dealing with Drawdowns.
- Mean-Reversion with RSI, Chandelier and PPO.
- Universe, Market Regime and Ground Rules.
- Sample Signals for IJR.
- Testing the Big Four.
- Plotting the Drawdowns.
- Setting a Risk-of-Ruin Stop.
- Conclusions.
 .... Dealing with Drawdowns.
The S&P 500 is currently in the midst of its worst monthly decline since May 2003 and its worst October since 2008. Traders and investors running long strategies were most likely hit with sizable drawdowns. I certainly was. My mean-reversion strategy was hit with its biggest drawdown and my momentum-trend following strategy took a hit.
Before updating the mean-reversion strategy, it is a good time for a reality check. I checked in with Cesar Alvarez of AlvarezQuantTrading last week and he offered some good insights:
- Every decline is different, but they all rhyme.
- One needs to understand that we cannot always be making money. Drawdowns are part of the backtest results. More importantly, drawdowns will happen and the biggest drawdown is in the future.
- Using time stops can sometimes help you trade your strategy. I add time stops to my strategies, not because they help the results, but because they get me out of psychologically hard trades to be in. The time stops have a minor impact on my results, but a big impact on my psychology.
As traders and investors, the signal most important thing we can do is develop a strategy and implement that strategy (Plan your trade and trade your plan). Trading on the fly may seem exciting, but it is not the best way to achieve consistent results. We need a repeatable process based on rules for entry, exit, exposure and position sizing, among other things. We need to know our exit strategy before we enter a trade and before something negative occurs.
Mean-Reversion with RSI, Chandelier and PPO
My first mean-reversion strategy was introduced in June 2016 and there have been several updates along the way (see links below). The initial strategy began by buying when RSI crossed above 30 and selling when RSI crossed below 70, which means RSI first had to move above 70. The strategy evolved with the introduction of a portfolio approach with the major index ETFs and use of the Chandelier Exit and PPO for exits.
- A Portfolio Approach to Mean-Reversion Trading
- A Mean-Reversion System with the Chandelier Exit
- Mean Reversion: Catch the Knife or Wait for the Bounce?
- Mean Reversion with the Sector SPDRs
Universe, Market Regime and Ground Rules
Here are bullet points for the rules:
- The system trades SPY, QQQ, MDY and IJR (long only).
- The market regime must be bullish. This means the 5-day SMA is above the 200-day SMA for the S&P 500.
- The system buys when 5-day RSI moves above 30, which implies it was below 30 before the buy signal.
- The system sells when one of two things occur: (1) Price crosses below the Chandelier Exit (22,1) and the PPO (12,26,9) is already below its signal line or (2) price is already below the Chandelier Exit and the PPO crosses below its signal line.
- The signals are generated on the close and the entry-exit prices are based on the next open.
- The backtests are based on dividend-adjusted data, which means the dividends were added back into the price data for a total return picture.
- The starting portfolio is $100,000 and the commissions are $5 per trade.
The indicators used are explained in the ChartSchool. It is IMPERATIVE that you fully understand how these indicators work to fully appreciate how the system functions. Read, study, repeat.... The PPO article (here) and the Chandelier Exit (here).
Sample Signals and Trades for IJR
The chart below shows the S&P SmallCap iShares (IJR) with the Chandelier Exit in red, RSI(5) and the PPO(12,26,9). There were five entry signals this year and four exits. Thus, four complete trades and one open trade. The system was performing well until the big hit on the current trade (down 14% at this point).
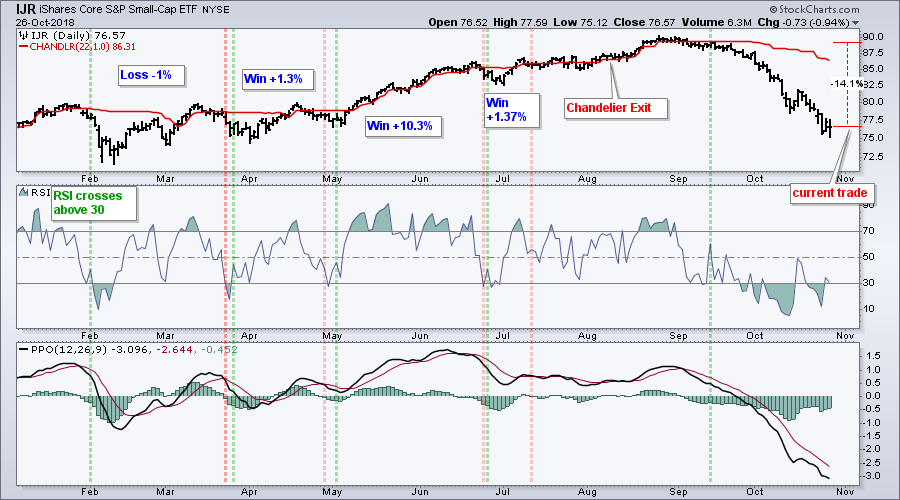
I added the PPO signal line crossover to the sell signal in an attempt to ride the short-term uptrend. Thus, the sell does not trigger until the close is below the Chandelier Exit and the PPO is below its signal line.
Testing the Big Four
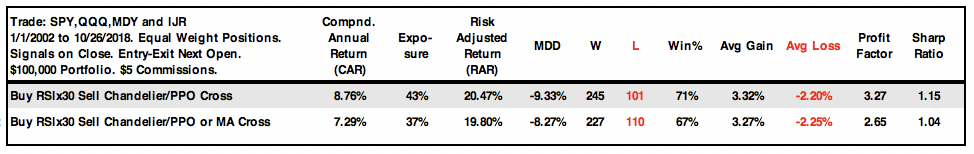
The next table shows the results for the four individual ETFs and the portfolio approach. I am testing from January 2002 to October 2018. This period starts in a bear market, includes another bear market and also includes a few volatile periods (May 2010, summer 2011 and summer 2015). The overall results reflect performance throughout different market conditions.
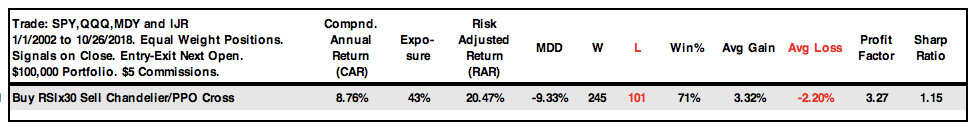
The Compound Annual Return was 8.76% with a Maximum Drawdown of 9.33%, which is occurring now. Note that the system was active 43% of the time (exposure) and the win rate was 71%. The Sharpe Ratio, which is a measure of risk-adjusted return, was above 1. The Profit Factor, which is gross profit divided by gross loss, was above 3, which is quite good.
The backtests were performed with Amibroker software and Premium Data from Norgate.
Plotting the Equity Curve
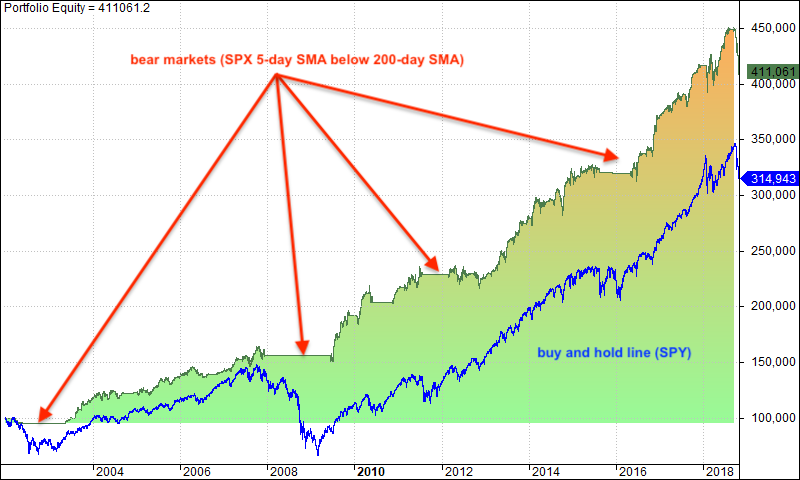
The chart below shows the equity line and the buy-and-hold line for SPY (blue line). The system outperforms buy-and-hold for two reasons. First, the system is out during bear markets and this preserves capital. Notice that flat lines in 2002, 2008 and 2016. Second, the gains during the bull market are strong and steady.
Plotting the Drawdowns
The next chart plots the drawdowns, which is measure the distance from peak to trough in the portfolio. The Maximum Drawdown exceeded -8% in 2008, 2012 and now 2018. The Maximum Drawdown was even below -9% this month. As you can see from this chart, drawdowns occur on a regular basis and we must learn to live with them. At this point, I do not think the strategy is broken.
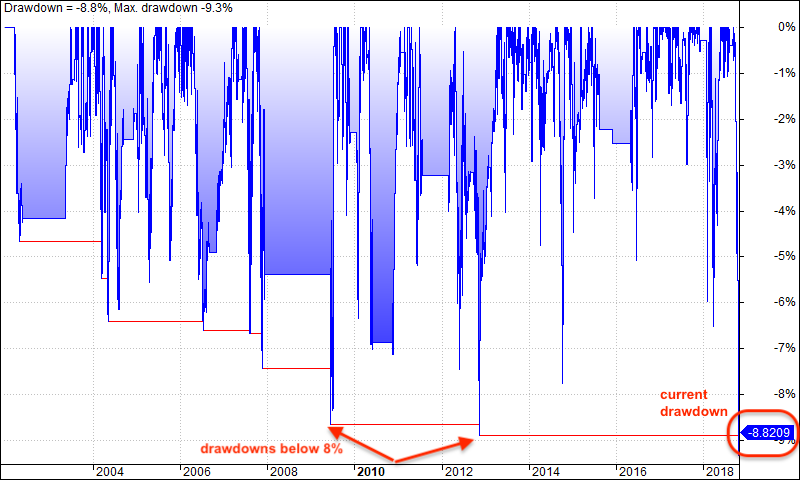
The system was profitable going into October, but the current drawdown wiped out the gains from the prior nine months. Technically, the system is still long SPY, QQQ, MDY and IJR because we have yet to get exit signals. The ETFs need to move above the Chandelier Exit before an exit signal is possible. Of the 343 trades over the last 16 years, 52 lasted 40 or more trading days.
Setting a Risk-of-Ruin Stop
It is always tempting to revisit the strategy and look for tweaks when profits are dragging or a drawdown hits. We must always keep in mind the law of unintended consequences when tweaking a strategy. We may find an adjustment that helps the current trade or drawdown, but adversely affects the prior trades and drawdowns.
A risk-of-ruin stop is necessary for most stock trading strategies because a stock can go to zero or even loose 80% of its value. This is not the case for the major index ETFs because they will not go to zero. On a buy-and-hold basis, the worst drawdowns for SPY where in the 50% area in mid 2002 and early 2009.
One possible tweak for this mean-reversion strategy would be to add an exit when the 5-day SMA crosses below the 200-day SMA for the given ETF (IJR, MDY, SPY, QQQ). I added this condition to the mean-reversion strategy and ran a backtest. The results below show a lower Compound Annual Return (8.76% versus 7.29%) and a lower Maximum Drawdown (-9.33% versus -8.27%). Thus, this tweak managed to lower the drawdown, but at the expense of returns. This is usually the trade off.
Conclusions
Drawdowns are part of the process because the markets cannot always move in our favor. It is important, therefore, that we develop a strategy to deal with these drawdowns before they occur. Having rules in place before the drawdown hits makes it easier to implement these rules and trade with discipline (hat tip to Gatiz).
Even though adding a risk-of-ruin type stop does not improve system performance, it does reduce the Maximum Drawdown and could help with trading psychology. Dealing with losses is difficult when there is no exit in sight. While the market could, and often will, rebound after we take our loss, it is sometimes best to take the loss for our psychological well being. This gives us time to regroup and prepare to move forward.
Plan Your Trade and Trade Your Plan.
- Arthur Hill, CMT
Senior Technical Analyst, StockCharts.com
Book: Define the Trend and Trade the Trend
Twitter: Follow @ArthurHill


