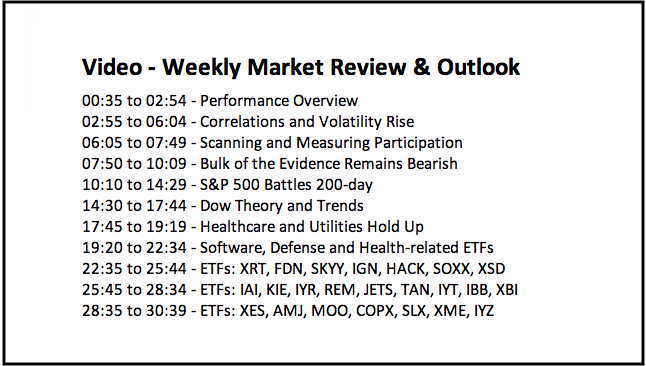
- Performance Overview.
- Correlations and Volatility Rise.
- Scanning and Measuring Participation.
- Bulk of the Evidence Remains Bearish.
- S&P 500 Battles 200-day.
- Dow Theory and Trends.
- Healthcare and Utilities Hold Up.
- Software, Defense and Health-related ETFs.
- Notes from the Art's Charts ChartList.
 ... Correlations and Volatility Rise
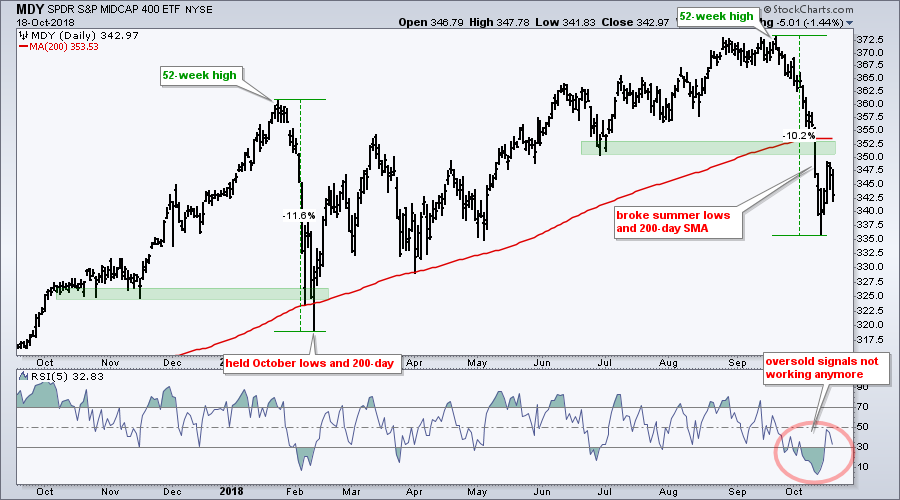
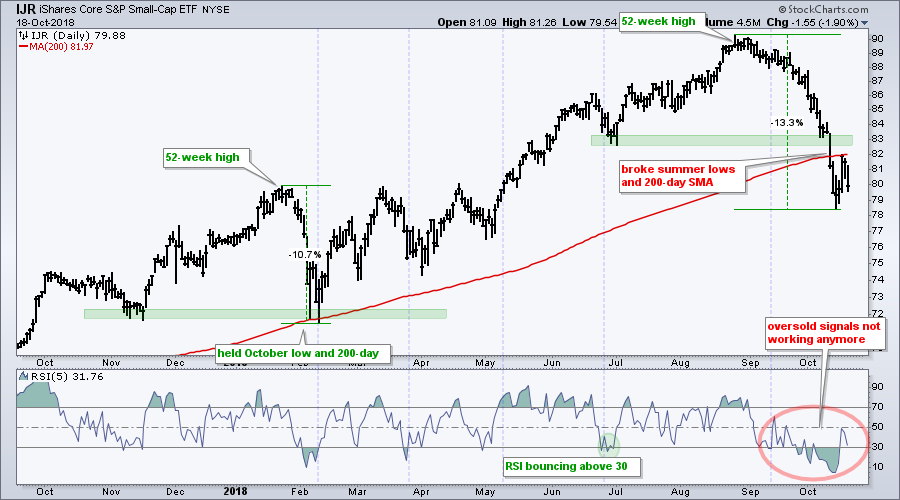
... The major index ETFs were trading near new highs in late August, but several industry group ETFs were not and lagging the broader market. The chart below shows the S&P 500 SPDR, S&P MidCap SPDR and S&P SmallCap iShares hitting new highs in late August, and then falling sharply in October.
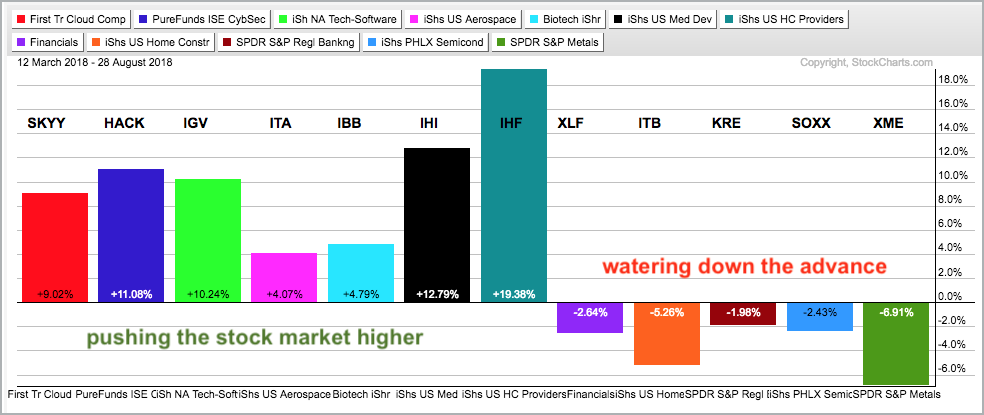
Despite new highs in the major index ETFs, several industry group ETFs were not participating. The Home Construction iShares (ITB), Semiconductor iShares (SOXX), Broker-Dealer iShares (IAI), Regional Bank SPDR (KRE), Oil & Gas Equip & Services SPDR (XES) and Metals & Mining SPDR (XME) peaked earlier in 2018 and were already trending lower.
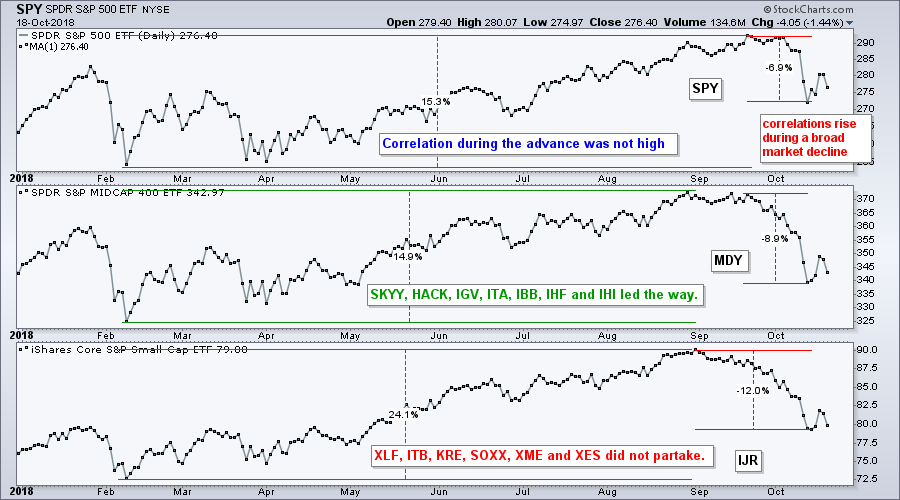
Despite these weak pockets, there was strength in other areas and this propelled the broad market indexes higher. The Cloud Computing ETF (SKYY), Cyber Security ETF (HACK), Software iShares (IGV), Aerospace & Defense iShares (ITA), Biotech iShares (IBB), Medical Devices ETF (IHI) and HealthCare Providers ETF (IHF) hit new highs in August.
The pockets of weakness softened the advance, lowered correlations and resulted in lower volatility. The S&P 500 Volatility Index ($VIX) was below 20 from late April to September. Adding pockets of weakness to an advance is like adding water to whiskey. The taste is still there, but the strength and volatility are diminished.
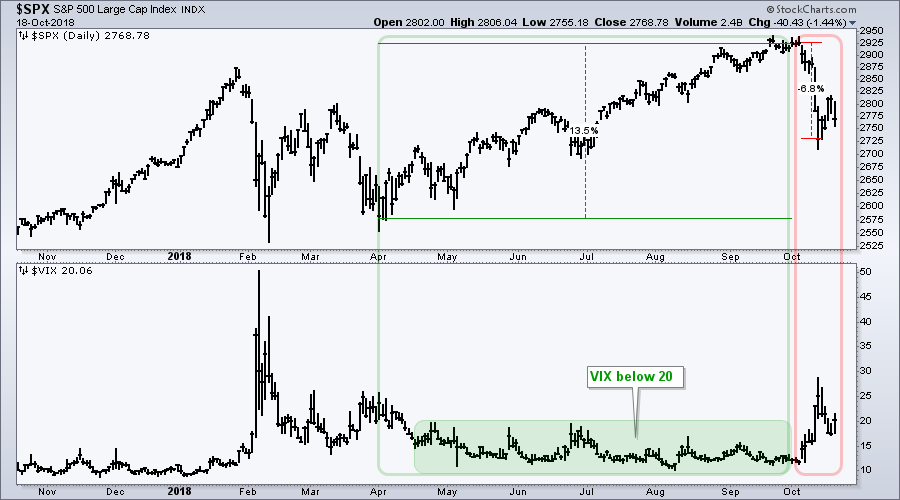
Things changed in October as many of the leaders weakened. This broadening of the decline caused correlations and volatility to rise as the VIX exceeded 20% for the first time since early April. The broad market advance did not lift all boats, but the October decline is sinking most boats. This is pretty much the way it works with bear markets. I would not look for volatility to settle until the VIX closes below 15 for several days.
Scanning and Measuring Participation
Some 80% of stocks are likely to decline during bear market environments and around 20% may buck the selling pressure. This percentage is not set in stone, but it gives us an idea of our chances right now. We have a 20% chance, at best, of picking a winner in this environment. Bear market odds are not appetizing.
In order to show the current odds, I ran a scan of stocks in the S&P 500 covering two periods. The first measures the Rate-of-Change from April 2nd to September 28th (126 days). The S&P 500 bottomed on April 2nd and September ended on the 28th. Of the 500 stocks in the S&P 500, 383 (76.6%) were up and 117 (23.4%) were up. Thus, we would have had a 76% chance of picking a winner by throwing darts.
I ran a second scan covering the last 14 trading days, which is month-to-date here in October. 86 stocks are up (16.8%) and 414 are down (82.8%). Thus, our chances of picking a winner in October was around 16%, which is pretty slim picking.

Bulk of the Evidence Remains Bearish
My broad market stance turned bearish last Friday because all nine of the broad market breadth indicators that I track triggered bearish signals. It only takes five of nine to turn the weight of the evidence bearish. These indicators are far from bullish signals so there is no need to rehash the charts.
I also noted on Wednesday that the October decline was much different than the February decline. In addition to the majority of breadth indicators turning bearish, we also saw breakdowns in the EW S&P 500 ETF (RSP), S&P MidCap SPDR (MDY) and S&P SmallCap iShares (IJR).
The charts below show MDY and IJR breaking their summer lows and closing below their 200-day SMAs for the first time since August 2017. Both managed to avoid closing below the 200-day SMA in February and found support near the October lows, October 2017 that is. Fast forward and both are now trading below support. This October decline is clearly worse than February.
S&P 500 Battles 200-day
The S&P 500 is battling the 200-day SMA with four crosses in the last six days. As noted in Thursday’s System Trader article, the index has crossed the 200-day SMA some 176 times since 1994 and this averages 7 per year. I also noted that the 50-day SMA is above the 200-day SMA and this cross is hard to beat for broad market timing.
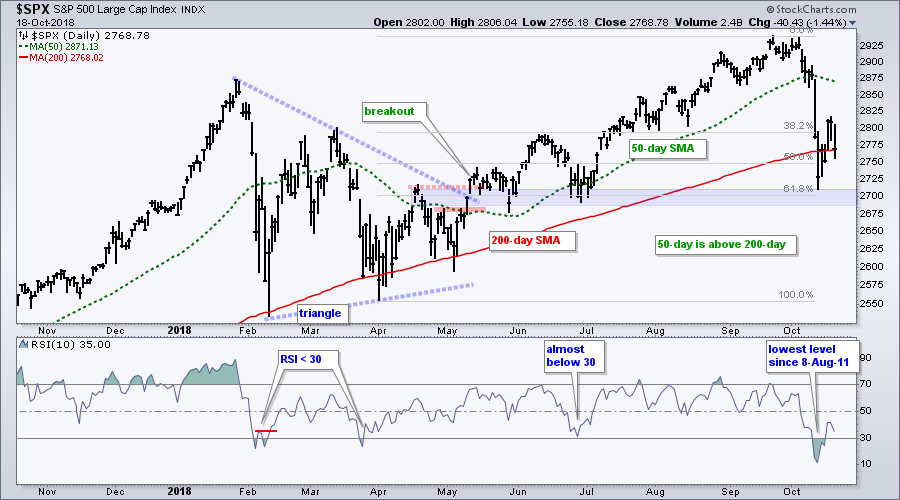
Even though I can still make the bullish case for the S&P 500, I think the bulk of the evidence is now bearish and I expect the S&P 500 to trade lower in the coming weeks. It is simply the last index standing. Looking far ahead, chartists considering a bottom pick can consider catching the falling knife if/when the index breaks the February low. The sky will definitely be crumbling if this happens.
Dow Theory and Trends
In his classic book, The Dow Theory, Robert Rhea notes the following, and I am paraphrasing:
- Neither the magnitude nor the duration of the primary trend can be forecast.
- A secondary movement typically retraces 1/3 to 2/3 of the prior primary move.
- Daily fluctuations are noise and cannot be forecast.
I am in bear market mode and this means I consider the primary trend to be down. I do not know how long it will last and how far it will extend. I do not know if this signal will result in a whipsaw or lead to an extended decline. Nobody knows! The only thing we can do is identify, act accordingly and change when the evidence changes.
Healthcare and Utilities Hold Up
Given the odds of picking a winner in the current environment, it does not make much sense for me to even feature some charts. As we have seen here in October, most stocks and equity ETFs will suffer during a broad market decline. Nevertheless, this is what I do and I will highlight some of the leaders.
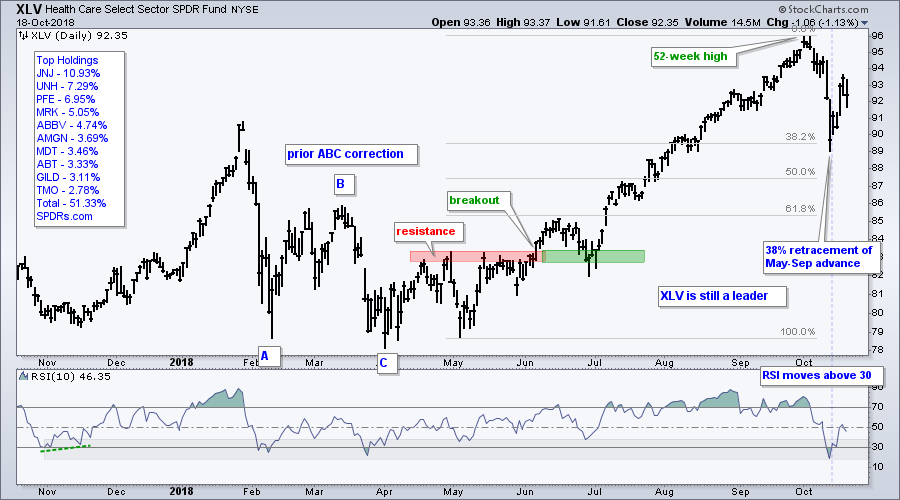
First up, the Health Care SPDR (XLV) and Utilities SPDR (XLU) are holding up the best among the sector SPDRs. The first chart shows XLV retracing around 38% of the May-Sept advance with a move to 90. RSI became oversold and the ETF bounced over the last five days. My concern is that an ABC correction unfolds. The decline to 90 is A, the bounce to 93.5 is B and another leg lower to 88 could be C.
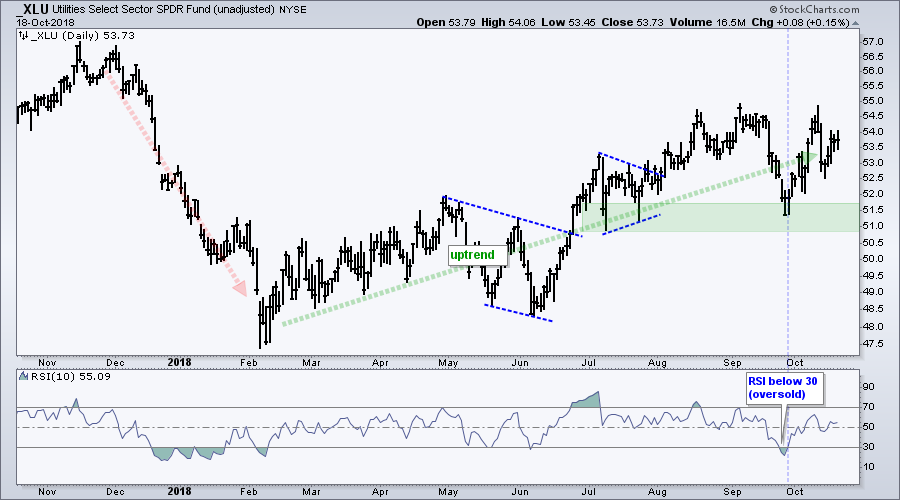
The Utilities SPDR (XLU) is the only sector with a gain in October (+2.05%). The other ten are down with nine falling 3% or more. How's that for broad selling pressure. XLP is down 2.15% and holding up the best of the losers. The chart below shows XLU trending up since early February and holding above support in the 51-51.5 area.
Software, Defense and Health-related ETFs
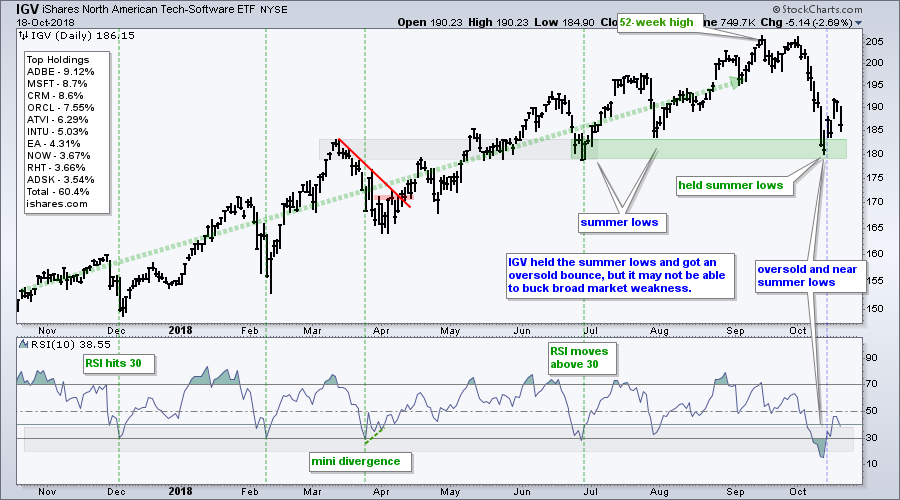
The summer lows represent my line in the sand when analyzing the charts. Indexes, ETFs and stocks that broke the summer lows are leading the way lower, while those holding above the summer lows show less weakness (relative strength). The first chart shows the Software iShares (IGV) bouncing off the summer-low support zone as RSI moved above 30.
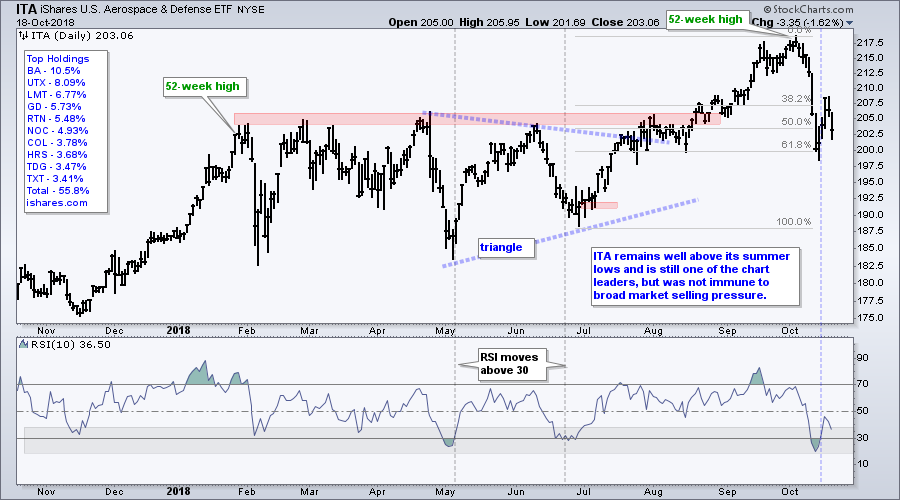
The next chart shows the Aerospace & Defense iShares (ITA) falling pretty hard in October, but still well above the late June low. The ETF bounced off the 61.8% retracement as RSI moved back above 30.
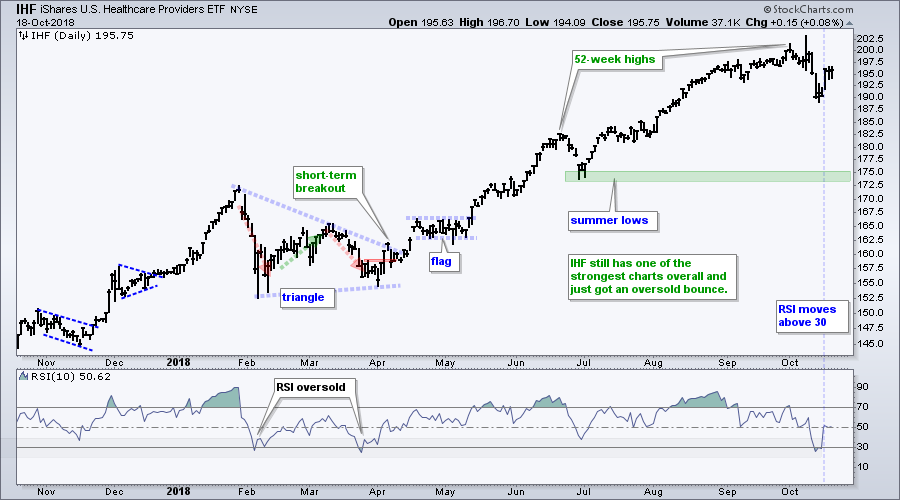
The HealthCare Providers ETF (IHF) is perhaps the strongest of all because its retracement was the shallowest. The ETF fell two days last week, became short-term oversold and bounced as RSI moved back above 30.
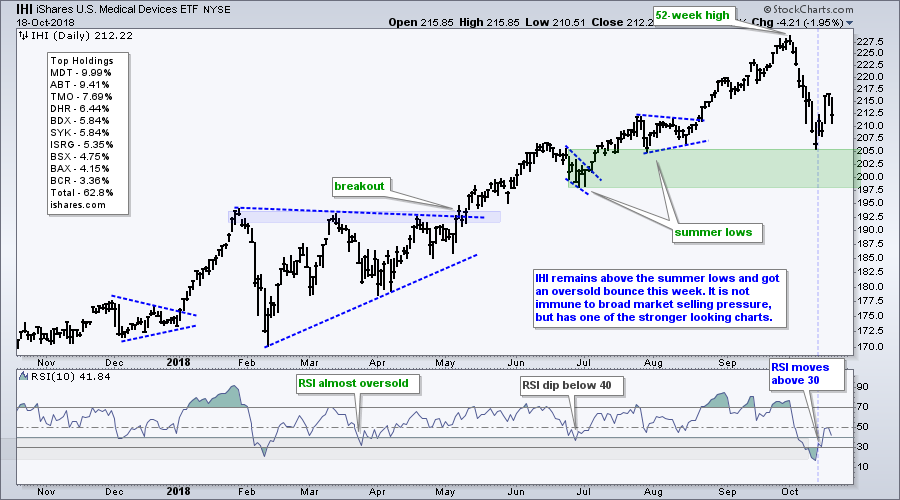
The Medical Devices ETF (IHI) fell back to the support zone marked by the summer lows and RSI moved below 30. The ETF bounced as RSI moved back above 30.
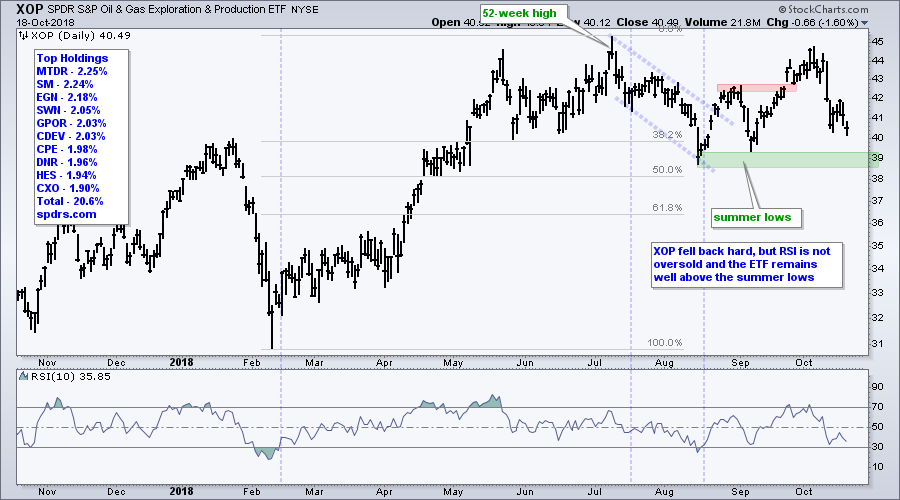
The Oil & Gas E&P SPDR (XOP) did not record a new high in September, but the ETF remains above the August lows and held up relatively well during the October sell off.
Notes from the Art's Charts ChartList
- Chart Leaders: IGV, ITA, IHF, IHI, XOP
- Recent Breakouts: GDX (GLD)
- Chart Laggards: ITB, FDN, SOXX, IAI, KRE, JETS, TAN, COPX, XME, SLX
- Failed Patterns: XES, AMJ, KIE, IYT
- Recent Breakdowns: XRT, SKYY, HACK, IBB, XSD, IGN, REM, IYR
- Color coded charts! Green annotations/comments are bullish, red annotations/comments are bearish and blue annotations/comments depict a pattern or setup (flag, wedge, triangle, oversold in uptrend).
- SKYY broke the summer lows with a double digit decline. Prior double digit declines in Feb and Apr did not break prior lows.
- Even though the Insurance SPDR (KIE) remains above its summer lows, it is in one of the weakest sectors and fell sharply in October. It is not immune.
- The Biotech iShares (IBB) is above its summer lows, but reversed the six month uptrend with the October plunge. Also note that XBI broke the summer lows.
- The breakout attempt in the Oil & Gas Equip & Services SPDR (XES) failed miserably (again).
- AMJ should have broken out in early October, but did not and is in a downtrend since mid August.
- The Gold Miners ETF (GDX) is one of the few ETFs showing a gain in October.
- Click here for the Art's Charts ChartList.
Questions, Comments or Feedback?
I do not take symbol request and I cannot promise to response to all correspondence, but I will read it and take into under consideration. I greatly appreciate all feedback because it helps me improve the commentary and provides ideas for the future.

Plan Your Trade and Trade Your Plan.
- Arthur Hill, CMT
Senior Technical Analyst, StockCharts.com
Book: Define the Trend and Trade the Trend
Twitter: Follow @ArthurHill


