- Setting Benchmark Levels for Comparison.
- Analyzing the Top Sectors and Benchmark Lows.
- New Lows Expand on Latest Dip.
- Discretionary, Finance and Industrials Lead New Low List.
- Software and Cyber Security Hold Up.
- CheckPoint, Fortinet and FireEye.
- Food and Charts for Thought.
 ... Setting Benchmark Levels
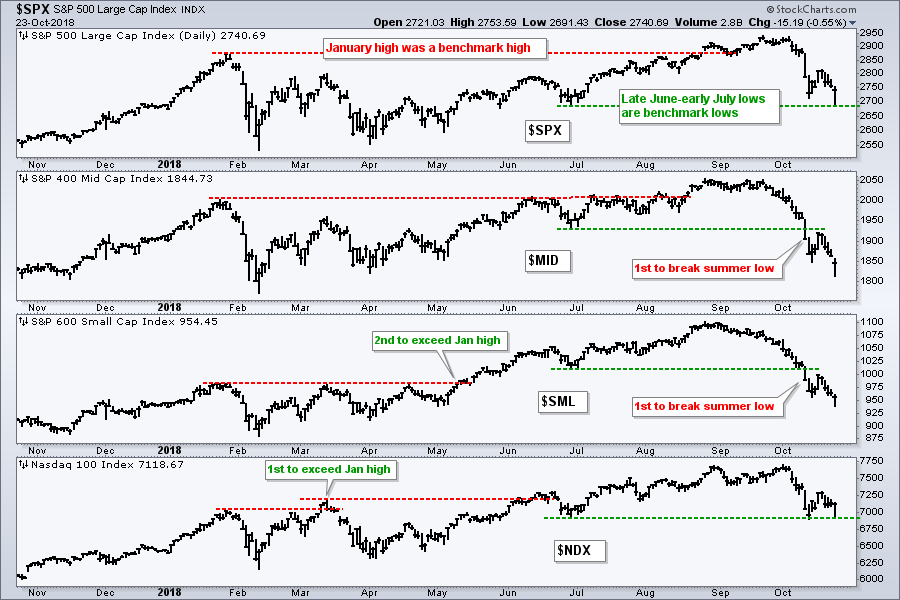
.... Chartists can set benchmark highs and lows for the major indexes and then use these to compare relative chart performance going forward. The chart below shows the S&P 500, S&P Mid-Cap 400, S&P Small-Cap 600 and Nasdaq 100. The January high marked a benchmark high earlier this year and became a key comparative level going forward. The Nasdaq 100 was the first to break this level and showed chart strength in mid March. The S&P Small-Cap 600 was the second to break this level in mid May and also showed relative strength. The S&P 500 and S&P Mid-Cap 400 did not break this level until August and were the laggards in this group.
The lows in late June and early July now mark the bench mark lows to watch going forward. The S&P 500 and Nasdaq 100 tested these lows here in October, but held for the most part. The S&P Mid-Cap 400 and S&P Small-Cap 600 broke these lows on October 10th and they are leading the way lower.
Once set, benchmark highs and lows give chartists the ability to gauge relative chart performance without using any indicators. Indexes, ETFs and stocks that hit new highs this summer were part of the leadership gang. Those that did not, such as KRE, SOXX and ITB, were in the lagging group. Similarly, indexes, ETFs and stocks that held above their summer lows, such as XLV, IHF and IGV, are showing relative "chart" strength (less weakness). Those breaking below their summer lows are leading the decline and showing relative "chart" weakness.
Top Sectors and Benchmark Lows
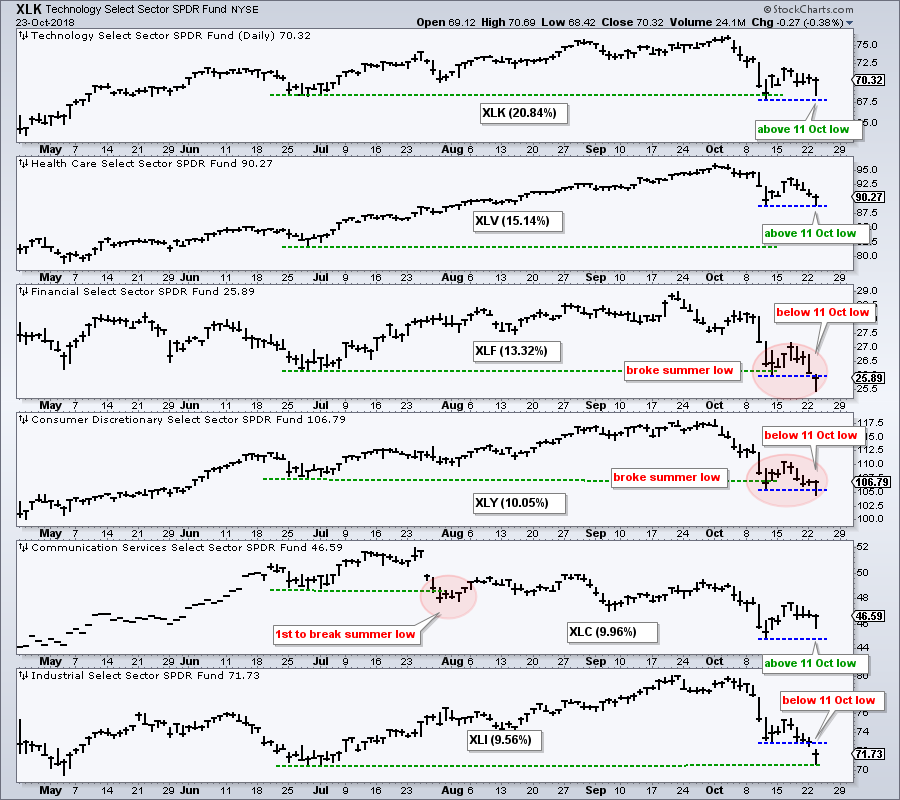
The next chart shows the top six sectors in the S&P 500 SPDR and these six account for around 80% of the S&P 500. The Financials SPDR, Consumer Discretionary SPDR and Communication Services SPDR broke their late June/early July lows (green lines). XLC was the first with a break in late July. The Technology SPDR and Industrials SPDR are testing these lows. The Health Care SPDR is the only "big" sector that remains well above these lows.
The blue lines mark a short-term bench mark low from October 11th. Notice that the Financials SPDR, Consumer Discretionary SPDR and Industrials SPDR broke this low and are leading the October decline. The Technology SPDR and Communication Services SPDR held above this low and show some relative "chart" strength over short-term. The Health Care SPDR tested this low and did not break it.
New Lows Expand on Latest Dip
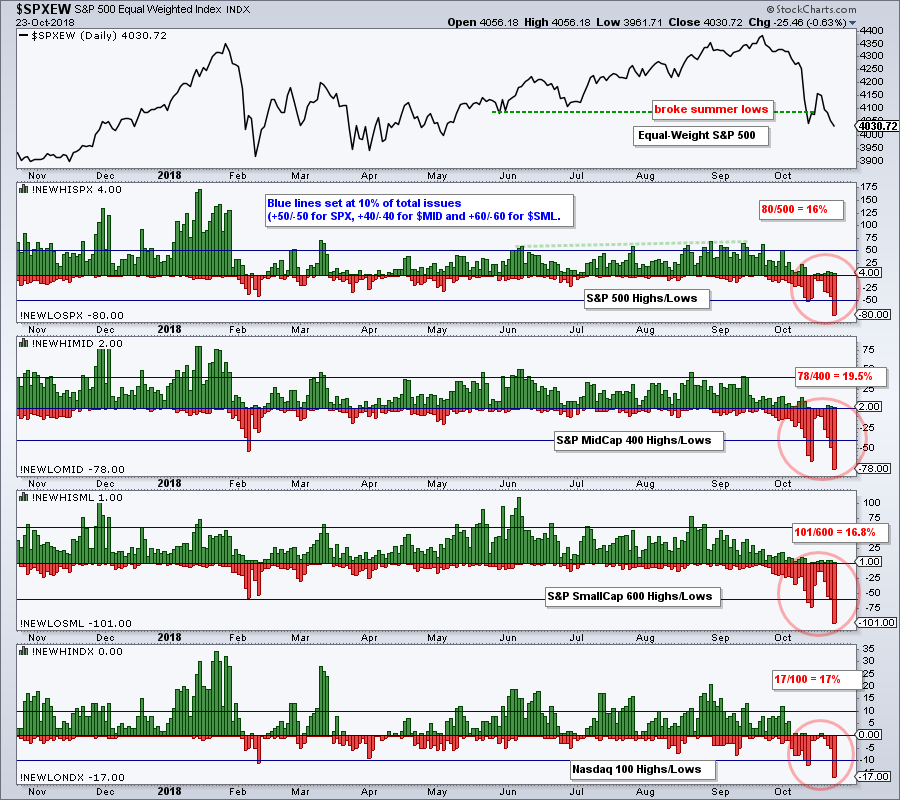
Even though the S&P 500 and Nasdaq 100 are still near their summer lows, and XLK and XLC did not break the October 11th low, the number of 52-week lows expanded again this week. This is negative because it means the number of stocks in strong downtrends is increasing. It is hard for an index to move higher when the number of components in strong downtrends is increasing.
The chart below shows the High-Low pairs for the four major stock indexes with blue lines set at the 10% thresholds (+50/-50 for the S&P 500). New lows accounted for 16% of the S&P 500, 19.5% of the S&P Mid-Cap 400, 16.8% of the S&P Small-Cap 600 and 17% of the Nasdaq 100. Yep, there are at least 17 strong downtrends in the Nasdaq 100.
Discretionary, Finance and Industrials Lead New Low List
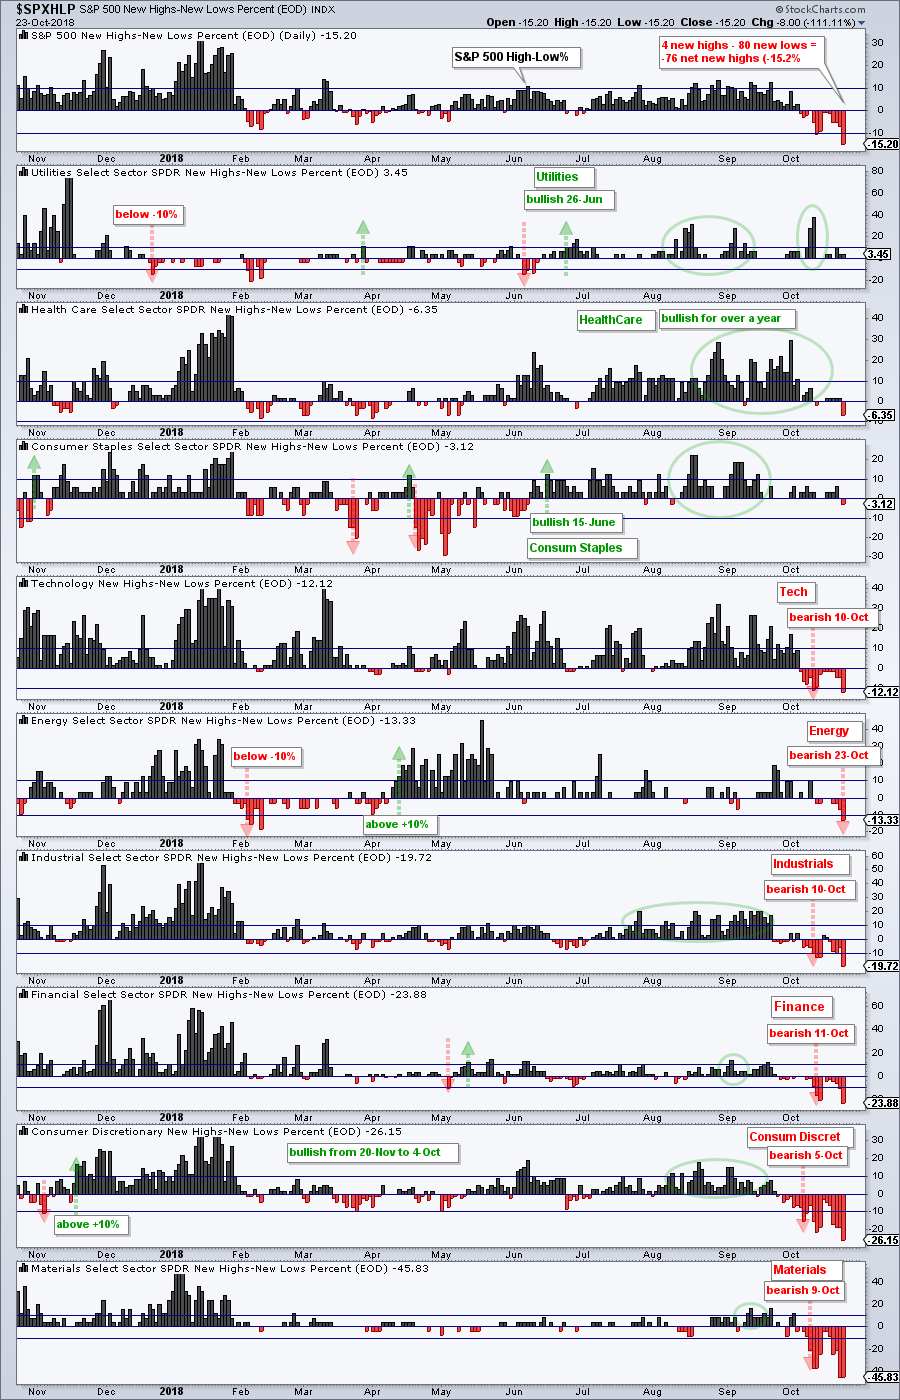
The next chart shows High-Low Percent for the S&P 500 and nine of the sector SPDRs. High-Low Percent equals new highs less new lows divided by total issues. There were 4 new highs in the S&P 500 and 80 new lows (4 - 80 = -76, -76/500 = -.152). The horizontal lines are set at +10% and -10% for signals. A bullish signals triggers with a move above +10% and remains active until a move below -10%, which triggers a bearish signal.
The Utilities, Healthcare and Consumer Staples SPDRs are the only three still on bullish signals. The Energy SPDR held out until yesterday and triggered bearish on Tuesday. The other five triggered bearish earlier this month. Note that High-Low Percent is at 19% or lower for the Industrials SPDR, Financials SPDR and Consumer Discretionary SPDR. These are big important sectors and there are lots of strong downtrends in these three.
Software and Cyber Security Hold Up
I am very hesitant to highlight bullish setups when my broad market stance is bearish. We are also smack dab in the middle of earnings season and volatility is above average. Perhaps we should just go for a long walk in the forest and enjoy the leaves.
Having clarified this stance, I am noticing less weakness in the Software iShares (IGV) over the last few months and the Cyber Security ETF (HACK) over the last two weeks. Of the key tech-related ETFs, IGV was the only one to hold above the summer lows and the ETF is above the October 11th low as well. MSFT, ADBE and CRM are the leaders in IGV.
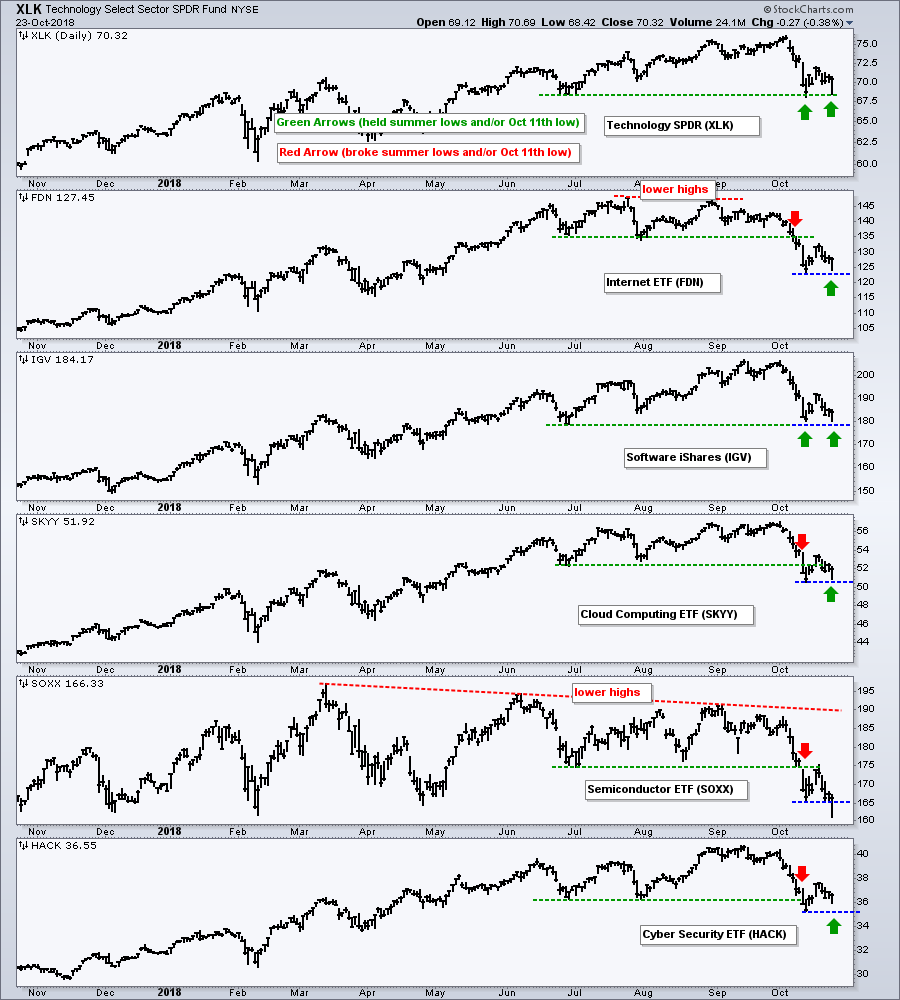 HACK broke the summer low, but rebounded sharply last week and is currently just above the summer low again (green line). The ETF is also above the October 11th low and showing less weakness than the broader market over the last eight days. ETFs showing less weakness (relative strength) during a decline are often the leaders on any bounce.
CheckPoint, Fortinet and FireEye
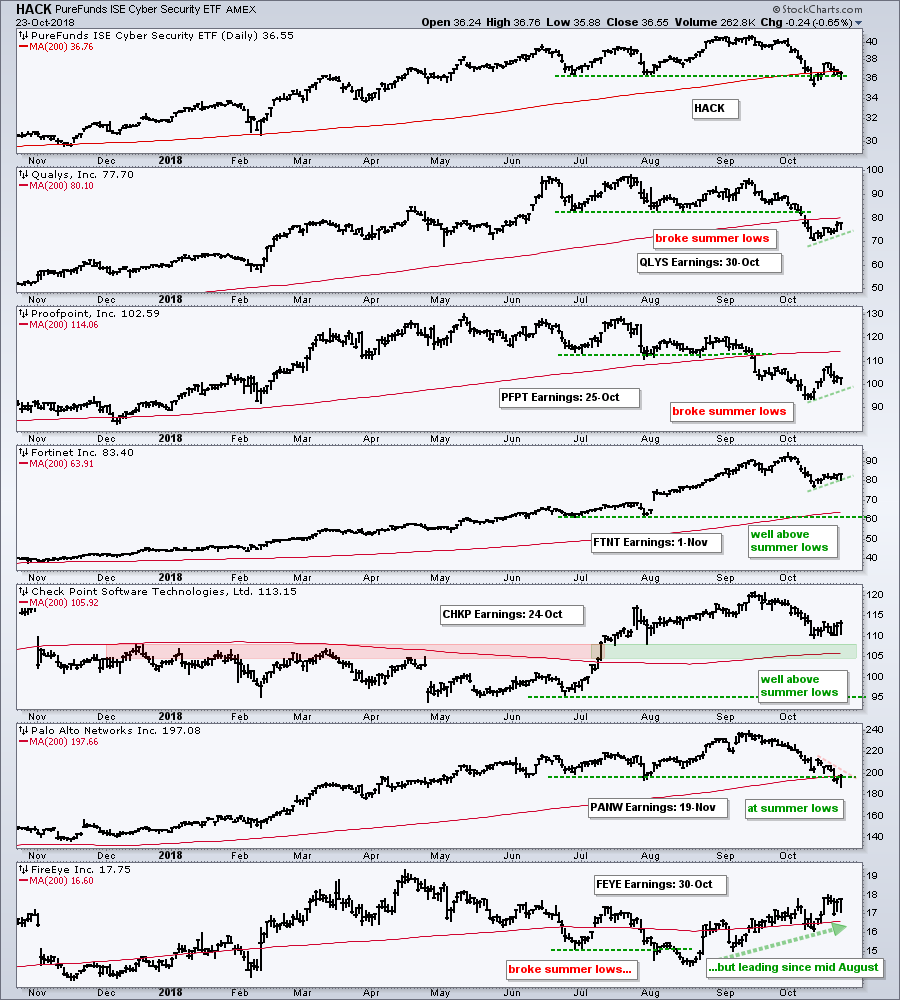
We are in the middle of earnings season and these stocks will be reporting soon. The next chart shows the Cyber Security ETF (HACK) with six key components. QLYS and PFPT broke their summer lows and 200-day SMA, but held above the 11-Oct lows this week and show some short-term relative strength. FTNT and CHKP are the strongest overall because they remain well above their summer lows. FTNT edged higher the last eight days and CHKP is consolidating above the breakout zone. PANW is testing the summer lows and 200-day SMA. FEYE was the weakest in August, but is the leader since mid August with a steady rise the last two months.
Food and Charts for Thought
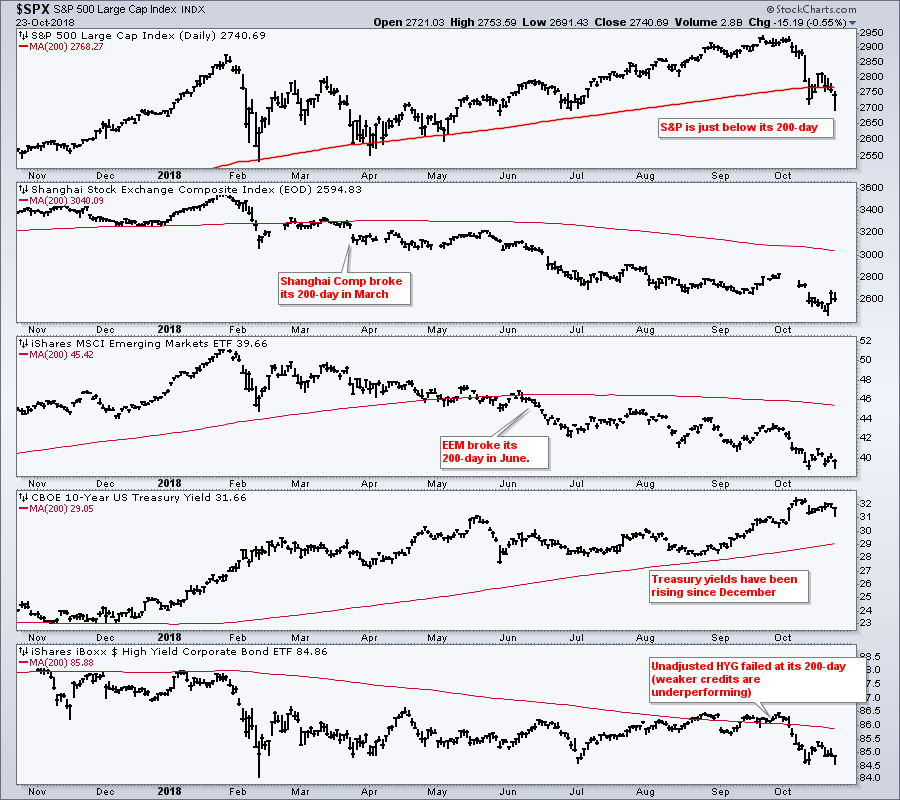
David Rosenberg of Gluskin Sheff talks about the Chinese stocks, Emerging Markets, High-Yield Bonds and Fed policy.
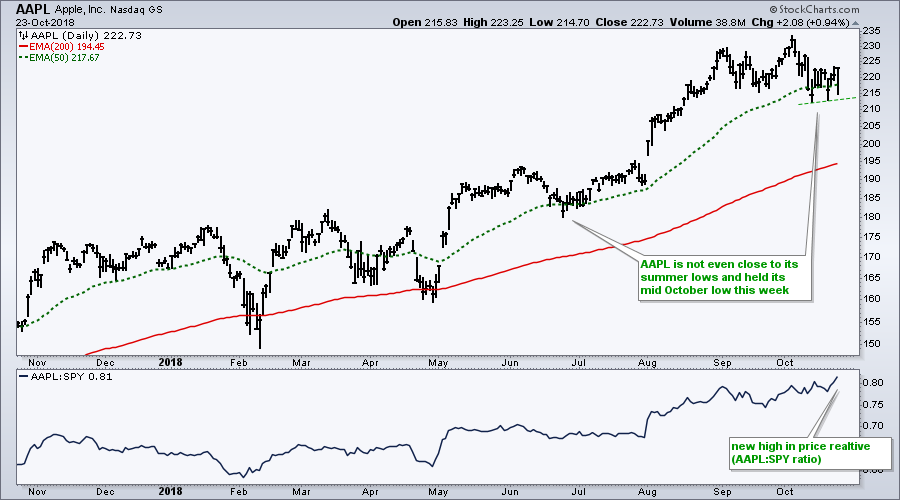
Chris Verrone of Strategas Research talks about the percentage of stocks making 20-day lows in the S&P 500, Industrials Sector and Healthcare Sector. He also notes that Apple still has one of the strongest charts (and it does).
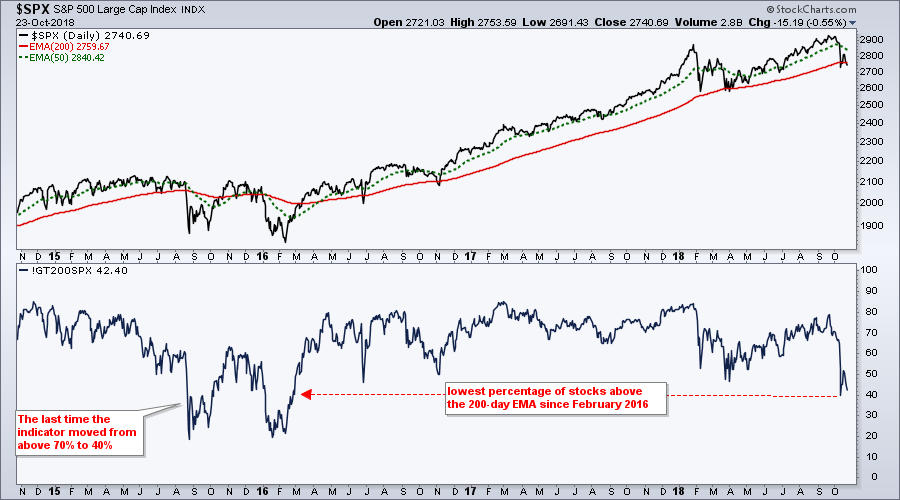
Craig Johnson, former president of the CMT Association and current analyst at Piper Jaffray, talks about election sentiment, the pullback process, the percentage of stocks above the 200-day and the chances for a test of the January-February lows in the S&P 500.
On Trend on Youtube
Available to everyone, On Trend with Arthur Hill airs Tuesdays at 10:30AM ET on StockCharts TV and repeats throughout the week at the same time. Each show is then archived on our Youtube channel.
Topics for Tuesday, October 2nd:
- NDX is Last Index Standing ($SPX, $MID, $SML)
- Consumer Discretionary Leads New Low List! (XLB, XLI, XLK)
- EW Staples, Utilities and Healthcare Hold Up (for now)
- Banks Break Down Further (XLF, KRE, KBE, IAI)
- Gold vs Dollar and XLU vs 10-yr Yield
- Walk around the World ($NIKK, $BVSP, $BSE)
- Click here to Watch
Questions, Comments or Feedback?
I cannot promise to response to all correspondence, but I will read it and take into under consideration. I greatly appreciate all feedback because it helps me improve the commentary and provides ideas for the future. Sorry, I do not take symbol requests.

Plan Your Trade and Trade Your Plan.
- Arthur Hill, CMT
Senior Technical Analyst, StockCharts.com
Book: Define the Trend and Trade the Trend
Twitter: Follow @ArthurHill

