- Healthcare Sector Shows Leadership.
- Big Moves in %Above 50-day EMA.
- Healthcare Providers and Medical Devices Break Out.
- HealthCare Providers Lead New High List.
- Nine Healthcare Stocks to Watch.
 ... Strong Breadth within Healthcare
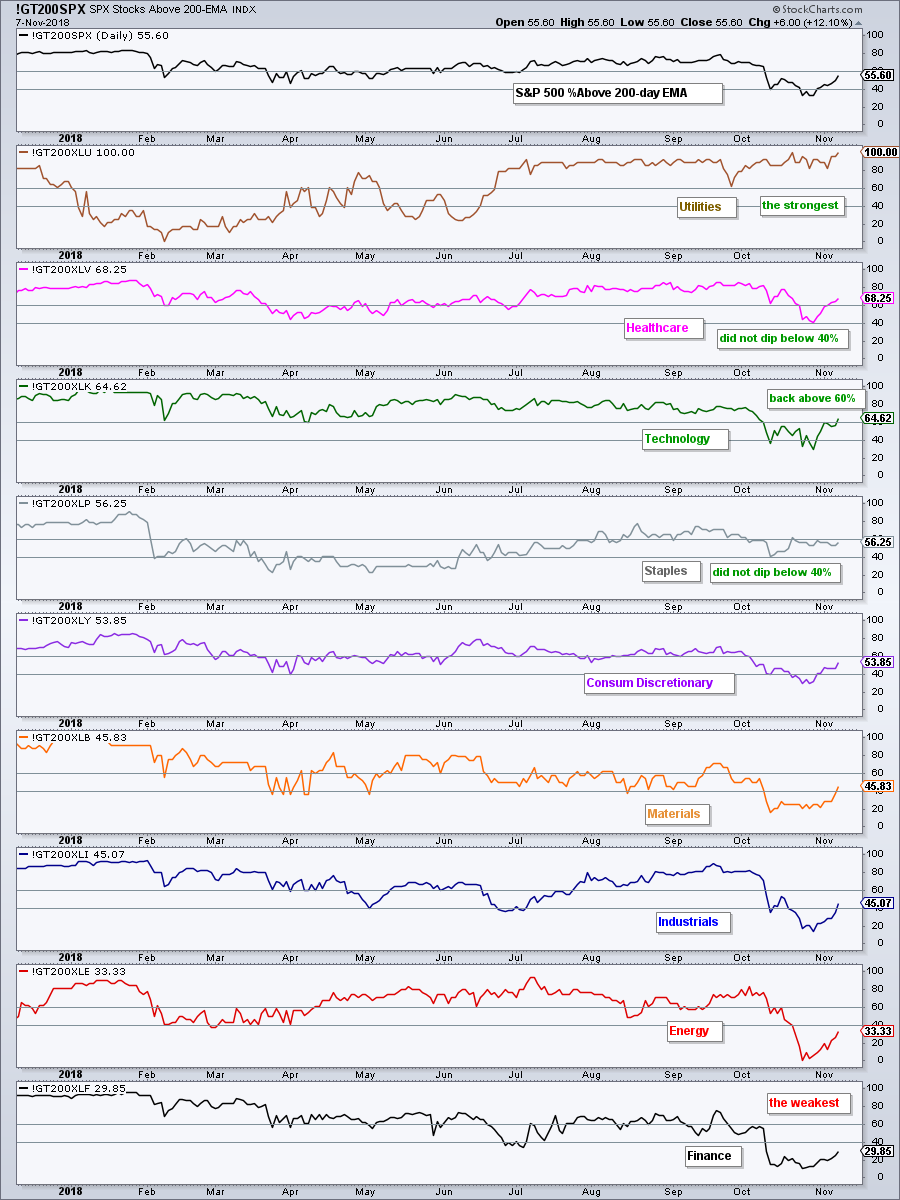
... The chart below shows the %Above 200-day EMA indicator for nine of the sector SPDRs. Note that we are still working on breadth indicators for XLRE and XLC. The 200-day EMA is a long-term trend indicator so this breadth indicator reflects long-term breadth within the sector.
The Utilities SPDR has been the strongest since early July and remains the strongest. The Health Care SPDR held up the best because Healthcare %Above 200-day EMA (!GT200XLV) did not dip below 40% in October. Staples %Above 200-day EMA (!GT200XLP) also held above 40% in October. The rebound in Tech %Above 200-day EMA (!GT200XLK) is one of the surprises this month because it is the first of the deep dippers to recapture the 60% level. In fact, XLK has the third highest reading of these nine sectors and is back on the leaderboard.
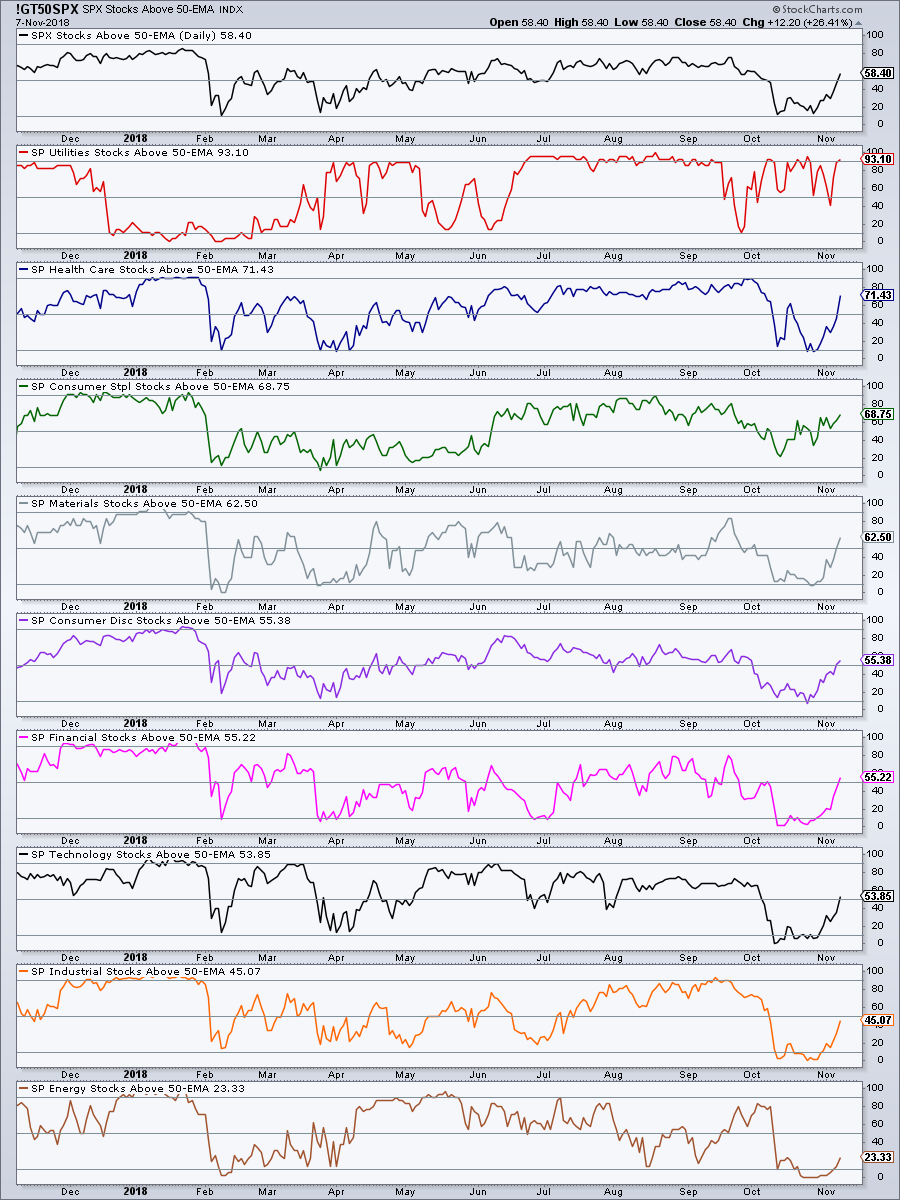
Big Moves in %Above 50-day EMA
The next chart shows the %Above 50-day EMA indicator. This is a medium-term trend indicator and this breadth indicator reflects medium-term breadth within the sector. Notice that utilities and healthcare remain at the top. This means both are showing strong long-term and medium-term breadth. The green outlines highlight five moves from below 10% to above 50% in a short time. This represents a rather sharp up-thrust in breadth and shows money moving into these sectors.
Healthcare Providers and Medical Devices Break Out
The Health Care SPDR (XLV), HealthCare Providers ETF (IHF) and Medical Devices ETF (IHI) stood out over the last six months and over the last six days.
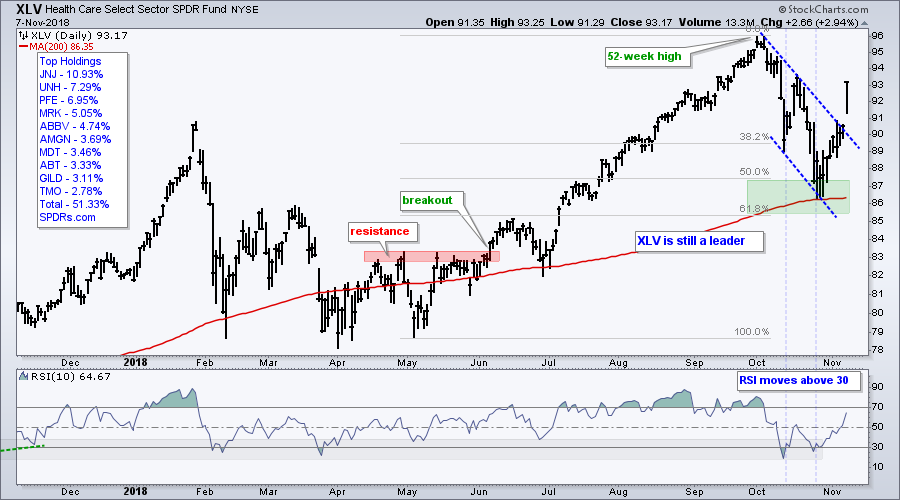
Of the 11 sector SPDRs, the Health Care SPDR and Utilities SPDR were the only two that did not close below the 200-day SMA at some point in October. The Health Care SPDR is also one of four sectors currently trading above the 50-day SMA. The other three are XLU, XLRE and XLP.
On the price chart, XLV touched the rising 200-day SMA in late October, but did not close below it. I do not view moving averages as support levels, but rather as yardsticks for comparing performance. XLV also retraced 50-61.8% of its May-October surge with a zigzag decline in October. The correction clearly ended with a gap and wedge breakout on Wednesday.
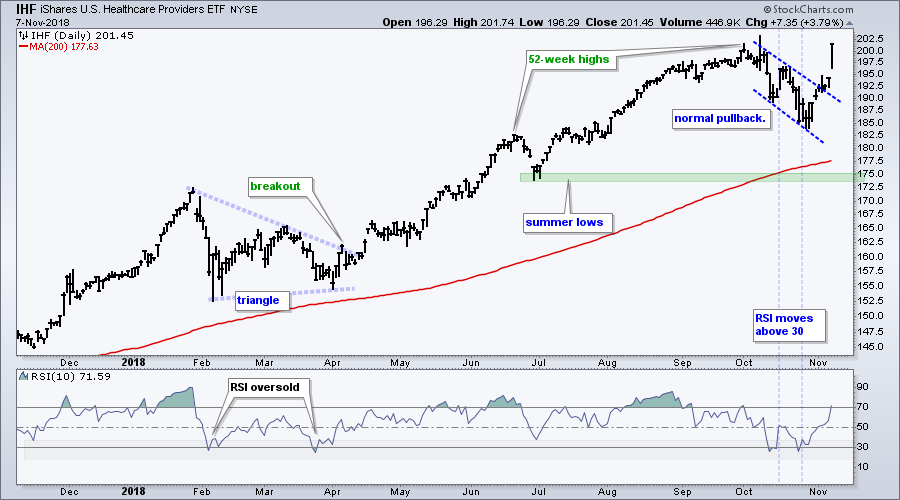
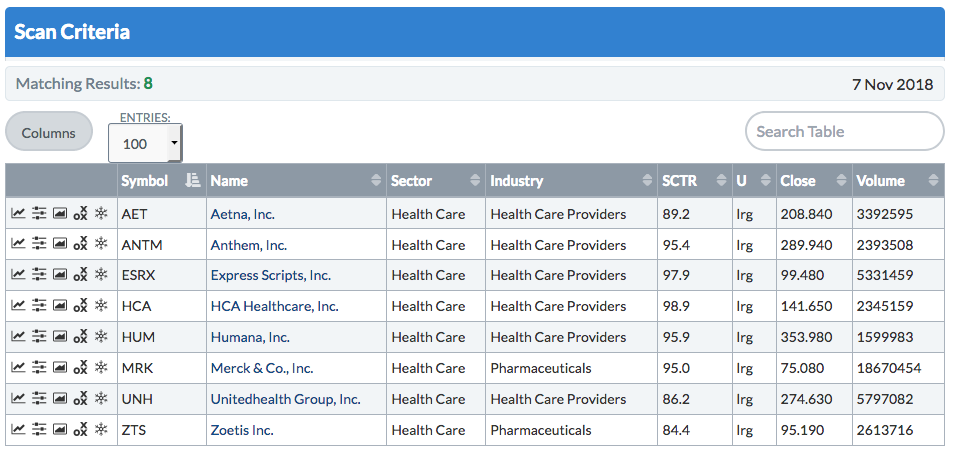
Within the healthcare sector, the HealthCare Providers ETF (IHF) pulled back with the rest of the market in October, but held well above the 200-day SMA and summer low. The ETF broke out just before the election and surged on Wednesday. Note that AET, CI, HUM, UNH and ANTM hit new highs on Wednesday.
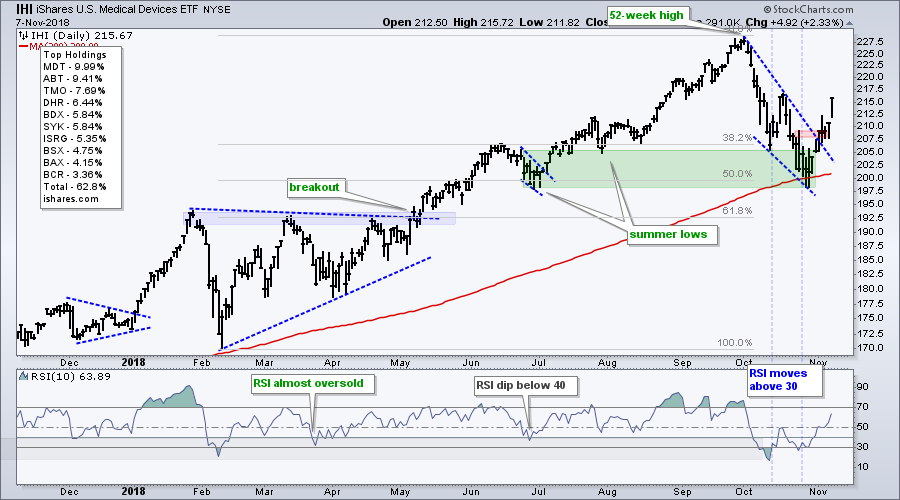
The Medical Devices ETF (IHI) pulled back with a deeper decline than IHF, but ultimately held the 200-day SMA. The ETF reversed near the 50% retracement and summer low with a wedge breakout just before the election.
HealthCare Providers Lead New High List
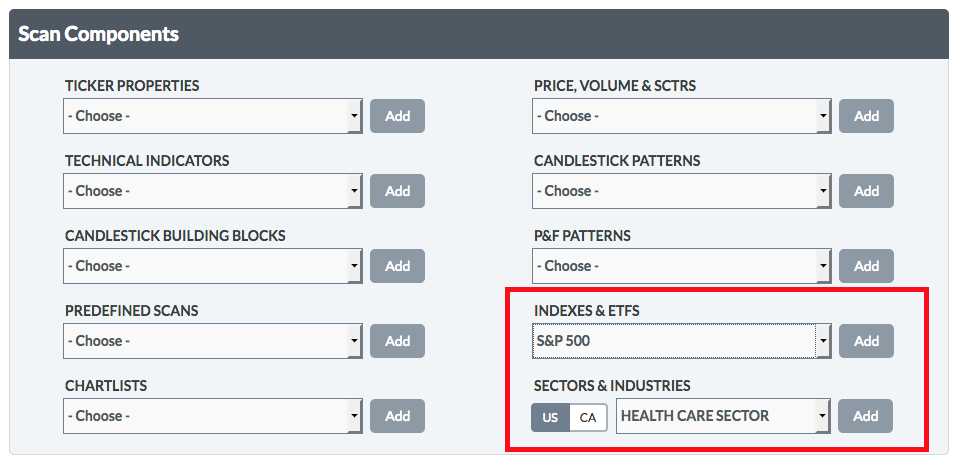
Chartist looking to find new highs within a group can use the scan code below. I first selected the S&P 500 as the main group and the healthcare sector as the sub-group. In the "Scan Components" section, select the group from the dropdown menu and then click add.
[group is SP500]
and [group is HealthCareSector]
and [[today's high > yesterday's daily max(252,high)]
or [yesterday's daily high > 2 days ago daily max(252,high)]
or [2 days ago daily high > 3 days ago daily max(252,high)]
or [3 days ago daily high > 4 days ago daily max(252,high)]
or [4 days ago daily high > 5 days ago daily max(252,high)] ]
Nine Healthcare Stocks to Watch
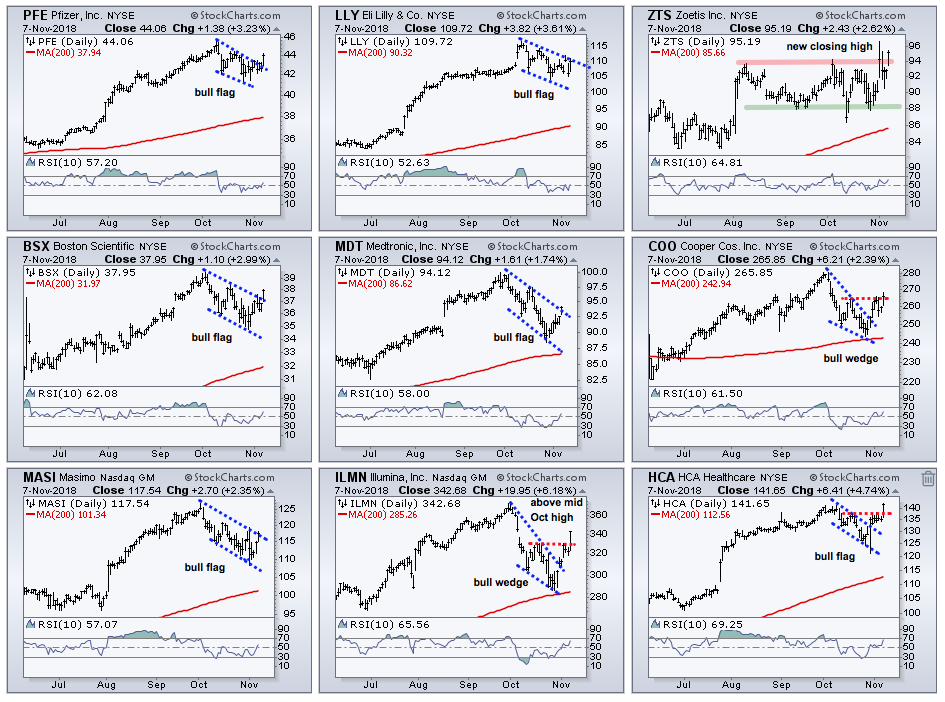
The next charts show nine stocks from the healthcare sector with bullish charts. All are above their 200-day SMAs, which are also rising. All of them held above these moving averages during the October dip. ZTS, ILMN, COO and HCA are the four leaders here because they exceeded their mid October highs.
Plan Your Trade and Trade Your Plan.
- Arthur Hill, CMT
Senior Technical Analyst, StockCharts.com
Book: Define the Trend and Trade the Trend
Twitter: Follow @ArthurHill


