- Short-term Bounce Extends.
- XLY and XLF Lead Rebound.
- SKYY and SOXX Lead Tech-related ETFs.
- Gold Holds Breakout.
- Crude Hits Moment-of-Truth.
- Bonds Continue to March South.
- Stocks to Watch: DIS, VZ, CSCO, MSFT, MA, V and JNJ.
 ... Short-term Bounce Extends
Stocks were deeply oversold in late October and there were several up gaps on October 31st. The gaps and subsequent bounces reverses the short-term downtrends, but I have yet to see enough strength to change my broad market stance, which remains bearish.
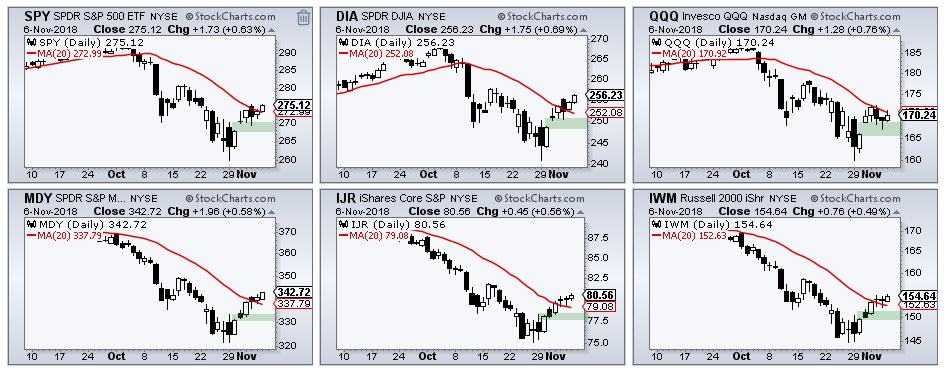
The next charts will focus on the gaps in the major index ETFs, key sector SPDRs and some tech-related ETFs. I am using 2-month CandleGlance charts with the 20-day SMA in red. I do not view this as a support or resistance level. Instead, it is a yardstick we can use to compare performance. ETFs above the 20-day SMA are leading and ETFs below the 20-day SMA are lagging. Leading or lagging, the short-term trends are up as long as these gaps hold. The trouble starts when/if the majority of these ETFs start filling their gaps.
The first chart shows six major index ETFs. SPY, DIA, MDY, IJR and IWM gapped up on October 31st and moved higher after the gaps. These five are also above their 20-day moving averages. QQQ stalled after the gap, but the gap is holding so the short-term cup is half full. QQQ is below the 20-day moving average and lagging the other five over the last six days.
XLY and XLF Lead Rebound
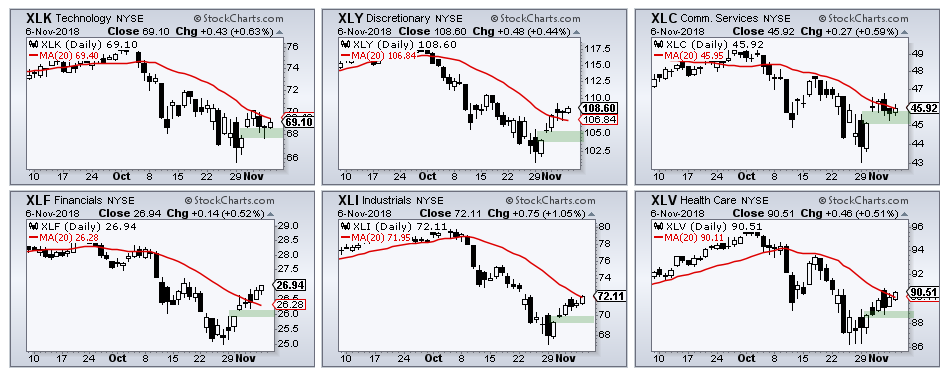
The next CandleGlance group shows the six biggest sectors. Together, these six account for around 79% of the S&P 500 SPDR (SPY). The green zones mark the gaps and/or breakouts, and these levels also mark first support. A move below the green zone would fill the gap and negate the breakouts. XLK and XLC are just below their 20-day moving averages and lagging a little. XLY and XLF are the furthest above and leading the last six days.
SKYY and SOXX Lead Tech-related ETFs
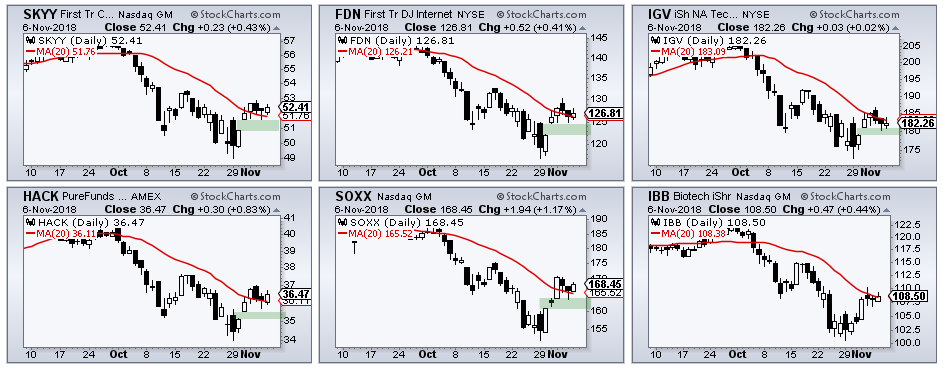
The next chart shows six tech-related ETFs with gaps and/or surges in late October. SKYY is stalling just after the gap with what may be a small flag or pennant. SOXX had the biggest bounce and is above its 20-day moving average. IGV had the weakest bounce and is the only one below its 20-day.
Gold Holds Breakout
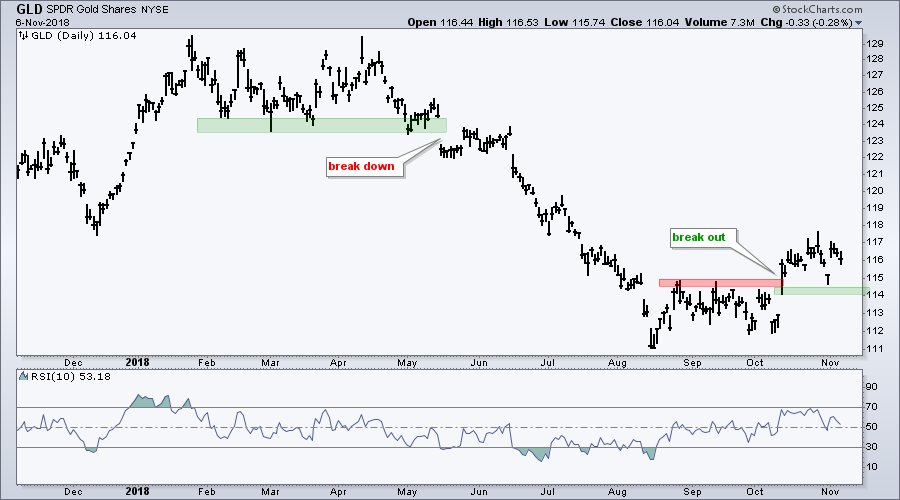
The Gold SPDR (GLD) surged in mid October and broke resistance at 115. The yellow metal turned volatile the last few weeks, but the breakout zone held with support marked in the 114 area. I would remain bullish on bullion as long as this breakout zone holds. In other words, it is bullish until proven otherwise.
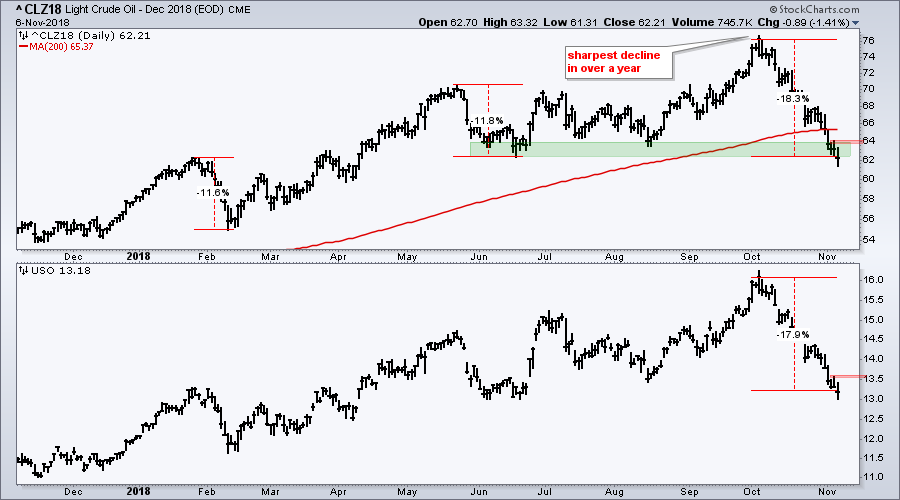
Crude Hits Moment-of-Truth
Crude is in the midst of its worst decline since January 2016 and testing the summer lows. December Crude (^CLZ18) broke below the 200-day SMA as well, but support is at hand and oil is very oversold. A break above 64 in crude and 16.7 in the USO Oil Fund (USO) could trigger an oversold bounce.
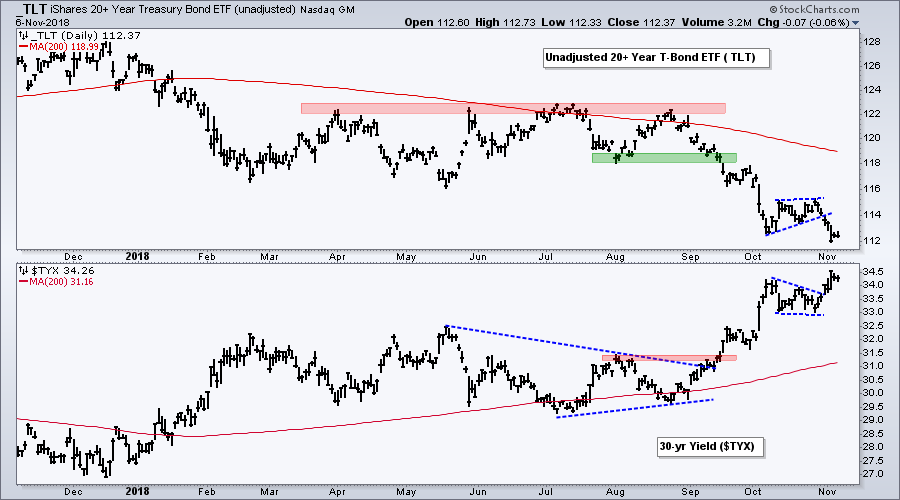
Bonds Continue to March South
The 20+ YR T-Bond ETF (TLT) continued its march lower as TLT broke down from a small rising wedge. The 30-yr T-Yield ($TYX), in contrast, broke out of a small wedge. The long-term trend for Treasury bonds is down and the long-term trend for the Treasury yields is up.
Stocks to Watch: DIS, VZ, CSCO, MSFT, MA, V and JNJ
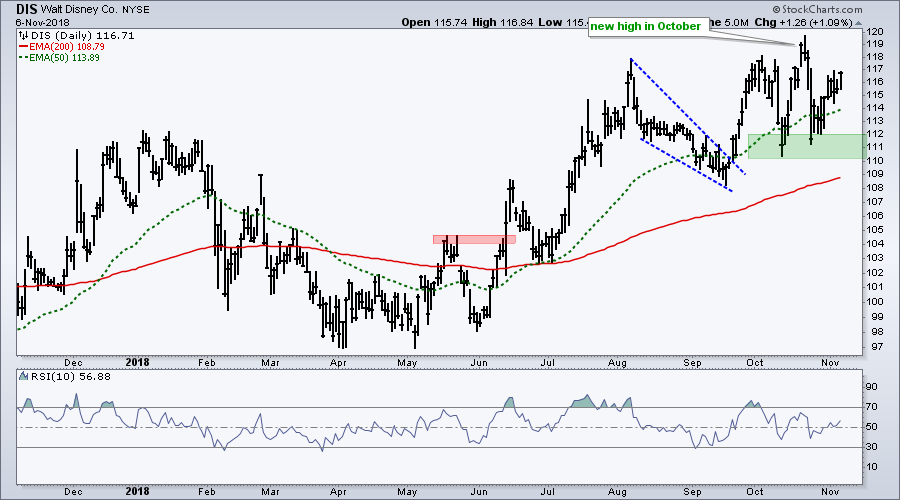
While I am still cautious on the broad market environment, there are still some stocks with uptrends and/or bullish charts. The following stocks are all above their 200-day EMAs and their 50-day EMAs are above their 200-day EMAs. Most recorded new highs recently and all of them held up relatively well in October.
Disney (DIS) continues to act well and is already back near its October high, which was a 52-week high.
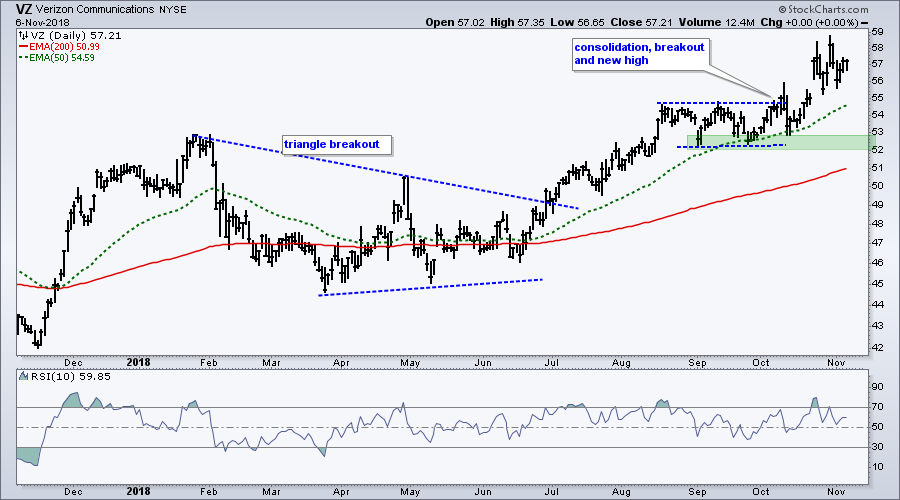
Verizon (VZ) broke out in October when most stocks were breaking down. The stock hit a new high last week and remains above the consolidation breakout.
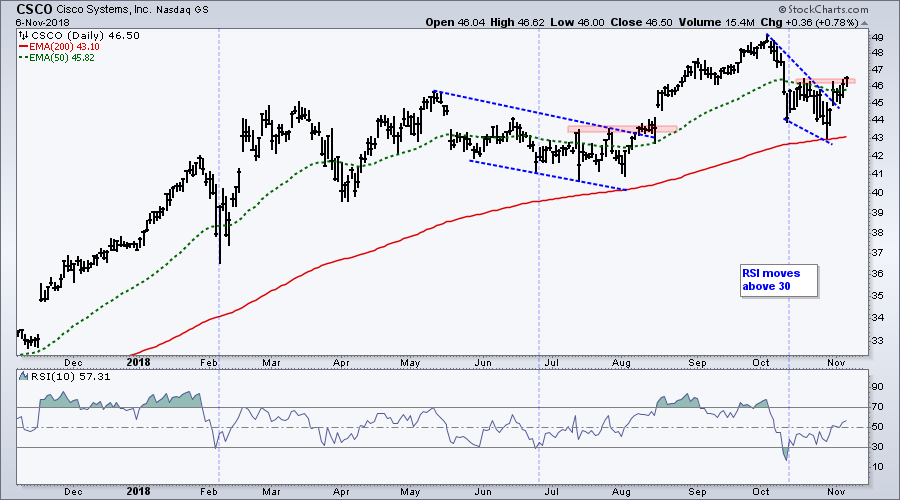
Cisco (CSCO) hit a new high in early October, fell back to the rising 200-day and broke out of the falling wedge with a gap up on October 31st. A close below 44 would warrant a re-evaluation.
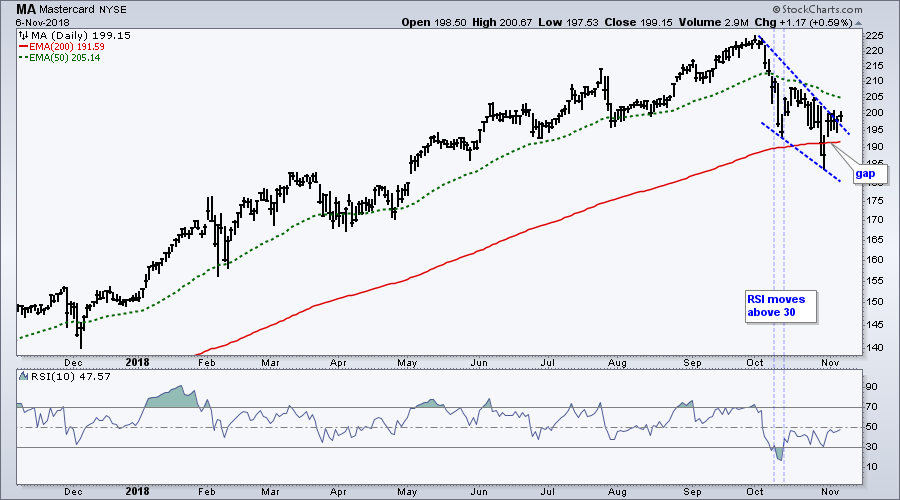
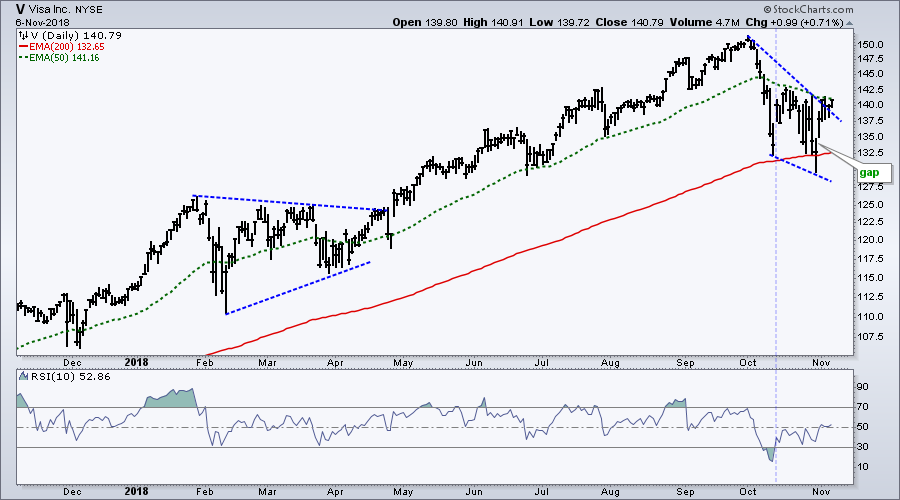
Mastercard (MA) corrected hard in October as RSI moved below 30 for the first time since the summer of 2016. How's that for a strong uptrend! RSI moved back above 30 in mid October, but MA continued lower with a falling wedge. Signs of a reversal are appearing as the stock gapped up on 31-Oct and broke the wedge line. Visa (V) has a similar chart.
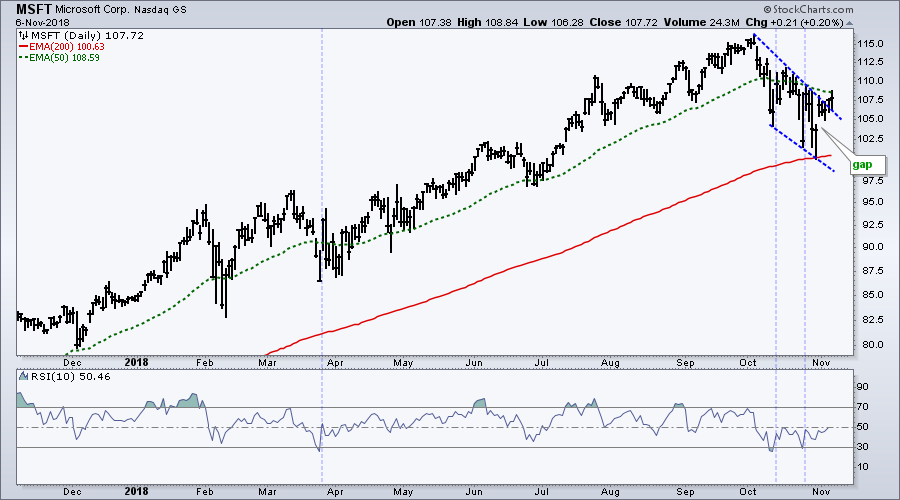
Microsoft (MSFT) has a chart similar to MA. The falling wedge touched the rising 200-day EMA as RSI dipped below 30 twice. MSFT gapped up and broke the wedge line, and it looks like the pullback is ending. A gap fill would call for a re-evaluation.
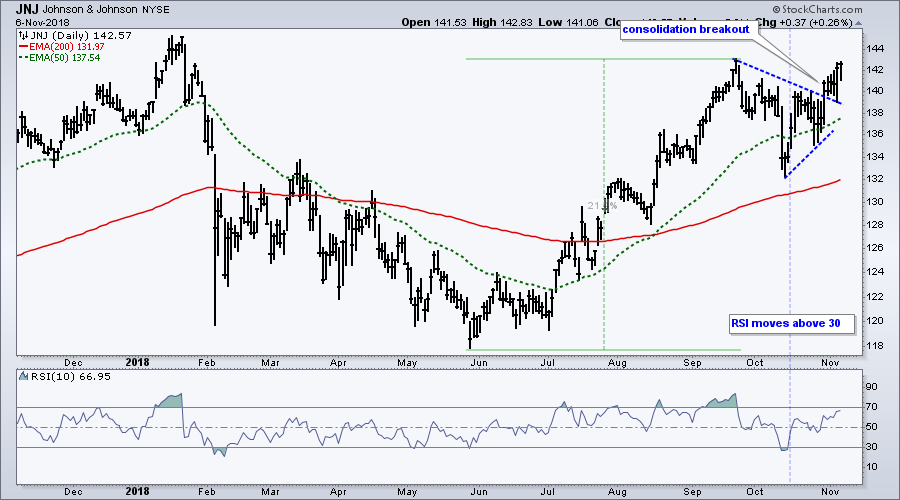
Stocks don't get more defensive that good old J&J, maker of Band-Aid, baby oil, Tylenol and Rolaids. At 10.92%, JNJ is also the biggest holding in XLV. The stock lagged the first half of 2018 and led in the second half. After a ~20% advance, JNJ consolidated in September-October and broke out of this consolidation last week.
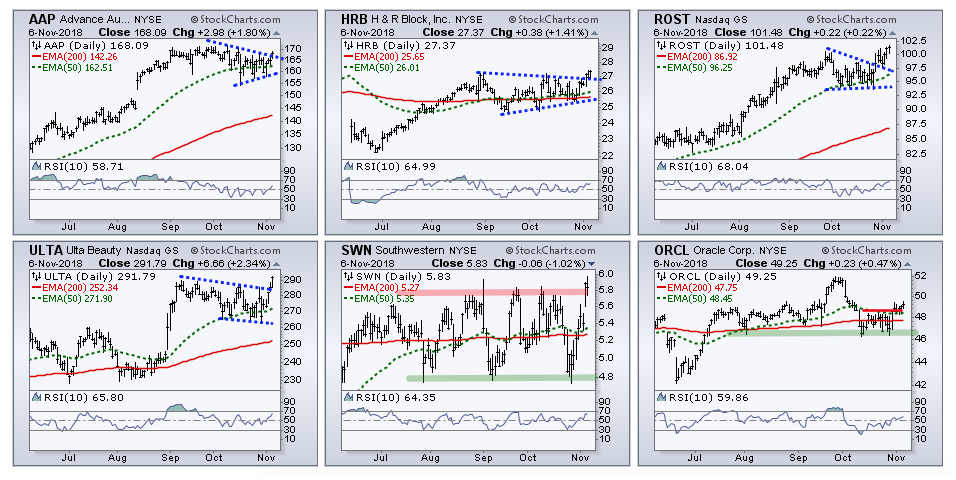
Other Stocks to Consider: AAP, HRB, ROST, ULTA, SWN, ORCL
On Trend on Youtube
Available to everyone, On Trend with Arthur Hill airs Tuesdays at 10:30AM ET on StockCharts TV and repeats throughout the week at the same time. Each show is then archived on our Youtube channel.
Topics for Tuesday, October 31st:
- Minding Gaps and Bounces ($SPX, $MID, $SML)
- Sector Overview (Comparing the Bounces)
- Is this Chart "On Trend?" (SOXX, IBB, IHF, IHI)
- Bonds, Gold, Dollar, and Oil
- Click here to Watch
Plan Your Trade and Trade Your Plan.
- Arthur Hill, CMT
Senior Technical Analyst, StockCharts.com
Book: Define the Trend and Trade the Trend
Twitter: Follow @ArthurHill


