- An Attempt at a Candlestick Reversal.
- Breadth Fails to Impress.
- More Stocks Breaking 50-day EMA.
- On Trend on StockCharts TV.
 ... An Attempted Candlestick Reversal
... The S&P 500 firmed over the last few days, but breadth remains weak overall. The first chart shows candlesticks over the last few months with a reversal attempt over the last four days. There is a filled candlestick, a dip below 260 and a recovery, and then two filled candlesticks. The filled (black) candlesticks indicate that the close is below the open. Hollow (white) candlesticks form when the open is above the close. Overall, the four candlesticks represent a reversal attempt, but we have yet to see any follow through. A break above the pattern high would be short-term bullish.
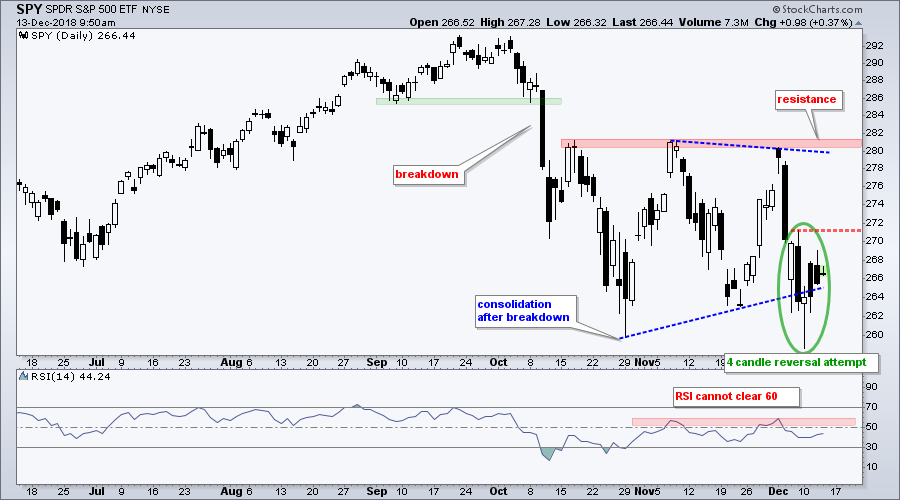 HOWEVER, the broad market environment is not bullish (at best) or bearish (at worst). In addition, trading has been quite volatile since mid October and risk is above average. While a break above Friday's high would be short-term bullish, it is within the context of a bigger downtrend and the risk of failure is high. Overall, SPY broke down in October and then formed a consolidation the last six weeks. A consolidation after a breakdown is typically a bearish continuation pattern.
Breadth Fails to Impress
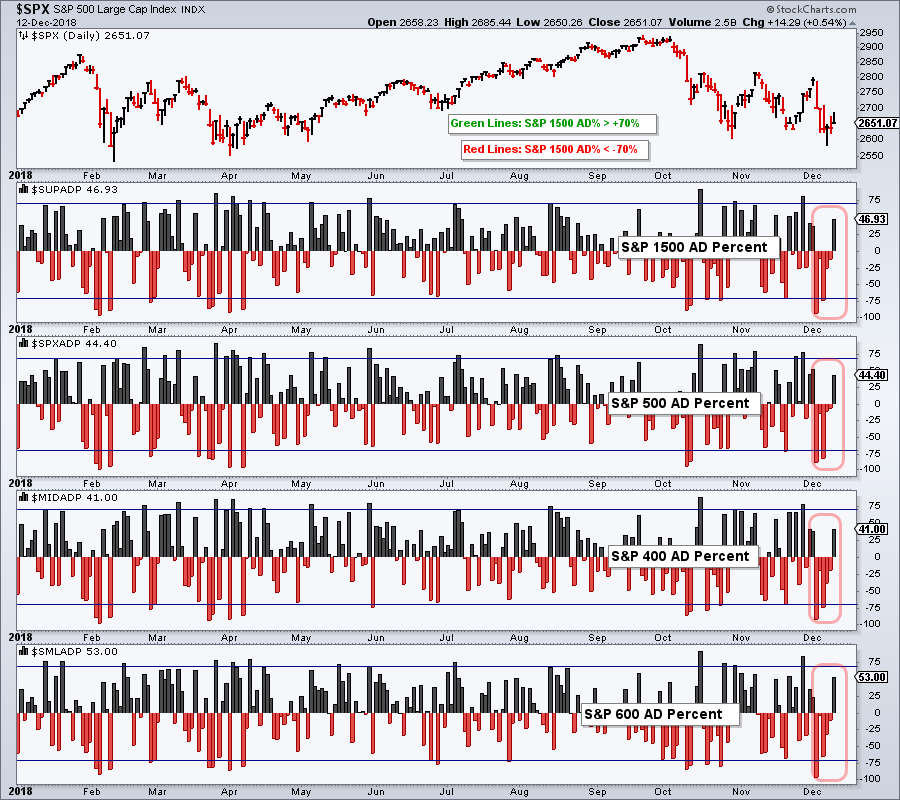
The next chart shows AD Percent for the S&P 1500, S&P 500, S&P Mid-Cap 400 and S&P Small-Cap 600. There was a strong upward breadth thrust in late November as AD Percent exceeded +70% for all four indexes. This showed strong upside participation, but there was no follow through in early December. Downside participation expanded again in early December as AD Percent exceeded -70% twice (red outlines). Yesterday's bounce was quite weak as AD Percent did not exceed +50% for the S&P 1500, S&P 500 and S&P Mid-Cap 400.
More Stocks Breaking 50-day EMA
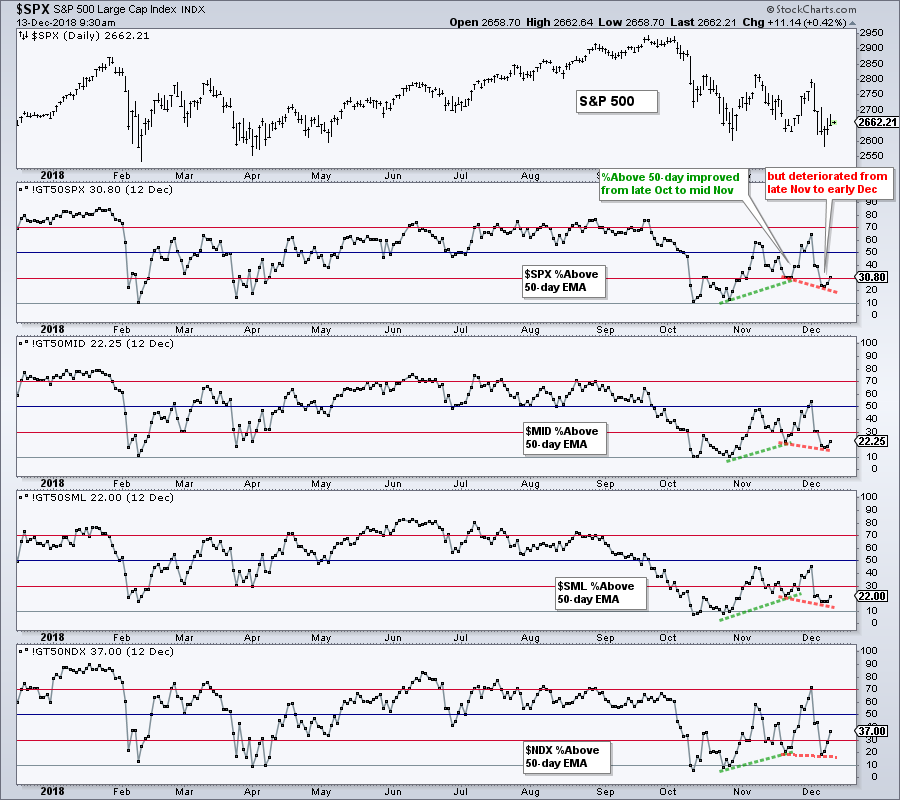
The next chart shows the percentage of stocks above the 50-day EMA for the S&P 500, S&P Mid-Cap 400 and S&P Small-Cap 600. This breadth indicator improved from late October to mid November as higher lows formed (green lines). These higher lows indicate that fewer stocks dipped below their 50-day EMAs in mid November. As with AD Percent above, this indicator switched back to negative with lower lows from late November to early December (red lines). More stocks dipped below their 50-day EMAs in early December than in late November. Thus, downside participation seems to be expanding again.
On Trend on Youtube
Topics for Thursday, December 13th:
- That's Not a Bounce Mate! (Measuring Breadth).
- Support is Suspect in a Downtrend ($SPX, $SPXEW).
- Bear Market Expectations Apply (Divergences).
- EW Sectors Reflect Broad Weakness.
- Stocks to Watch (CHRW, IBM, INTC, EL, FLS...).
- Click here to Watch
- Arthur Hill, CMT
Senior Technical Analyst, StockCharts.com
Book: Define the Trend and Trade the Trend
Twitter: Follow @ArthurHill


