- Support Levels are Dubious in Downtrends.
- Continuation Patterns after Breakdowns.
- Mid-caps and Small-caps Lead Lower.
- Bonds Catch Bid as Stocks Fall.
- 10-yr Yield and Oil Fall Together.
- Gold Ignores Dollar Strength.
- Is it Really Worth It?
- XLU Hits New High.
- XLP Corrects within Uptrend.
- XLV Consolidates after New High.
- Notes from the Art's Charts ChartList.
 ... When Support Levels are Dubious
... As obvious as it seems, lower lows and lower highs are the order of the day in a downtrend. Thus, prices are expected to break prior lows and continue lower when the trend is down. Taking this downtrend concept one step further, one could also assume that support levels within downtrends are highly questionable and offer false hope. After all, lower lows are the norm, not the exception.
Our first job as chartists is to identify the bigger trend at work. Once trend direction is established, we can then set our focus and trading bias. I try to focus on resistance, bearish setups and bearish patterns during a downtrend. By extension, I try to ignore dubious support levels, bullish setups and bullish patterns. I am working under the assumption that the bigger downtrend is the dominant force at work. Such an environment favors bearish resolutions over bullish resolutions. Bearish patterns have a better chance at success than bullish patterns, while resistance levels have a better chance at holding than support levels. It is all about probabilities.
Invariably, there is always another support level below current prices and we could draw dubious support lines all day. Marking support levels in a downtrend is just creating more noise. The chart below shows the S&P 500 with at least nine possible support levels. As far as I am concerned, the trend reversed with the breakdown in mid October. Once the trend turned down, these support levels became noise in my book. I could even start adding Fibonacci retracements and create even more noise.
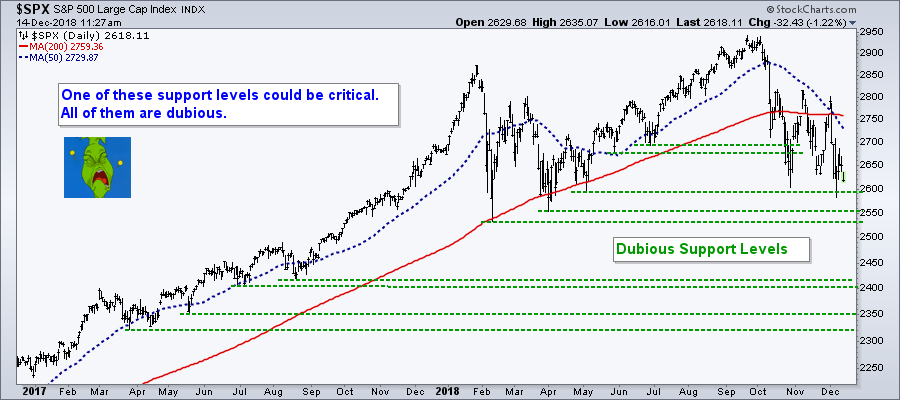
There is probably one "critical" support level in this bunch, but good luck picking the right one. The S&P 500 is clearly not "On Trend" and I will not be marking support levels until the index actually reverses its downtrend. In Dow Theory terms, the onus is on the bulls to prove the bears otherwise. Until then, I will respect the downtrend and avoid the noise, just like the Grinch.
Continuation Patterns after Breakdowns
The next chart shows weekly bars for the S&P 500 over the last five years. The index broke down with a sharp decline in October and then formed a consolidation the last seven weeks. A consolidation after a breakdown or sharp decline is a bearish continuation pattern. A break would signal a continuation lower. In contrast, notice that the consolidation earlier in the year formed after a new high and within an uptrend. This was a bullish continuation pattern because the prior move was up.
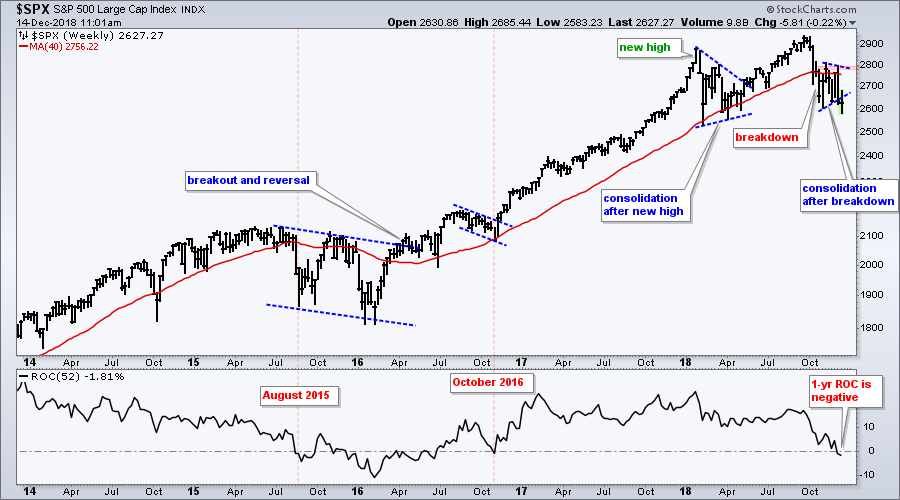
The indicator window shows the 52-week Rate-of-Change turning negative for the first time since October 2016. Thus, the rolling one year Rate-of-Change was positive for over two years. As in August 2015, investors are starting to feel the pain because the index is down over the past year.
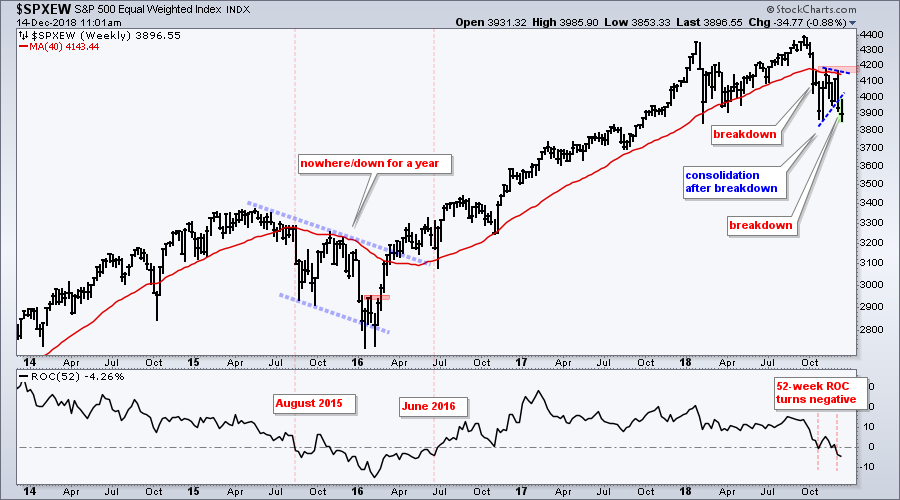
The next chart shows the S&P 500 Equal-Weight Index ($SPXEW), which reflects performance for the "average" stock in the S&P 500. This index also broke down in October and the 40-week moving average turned down over the last few weeks. A consolidation (triangle) formed after the breakdown and the index broke the lower line last week. This signals a continuation of the October decline.
Mid-caps and Small-caps Lead Lower
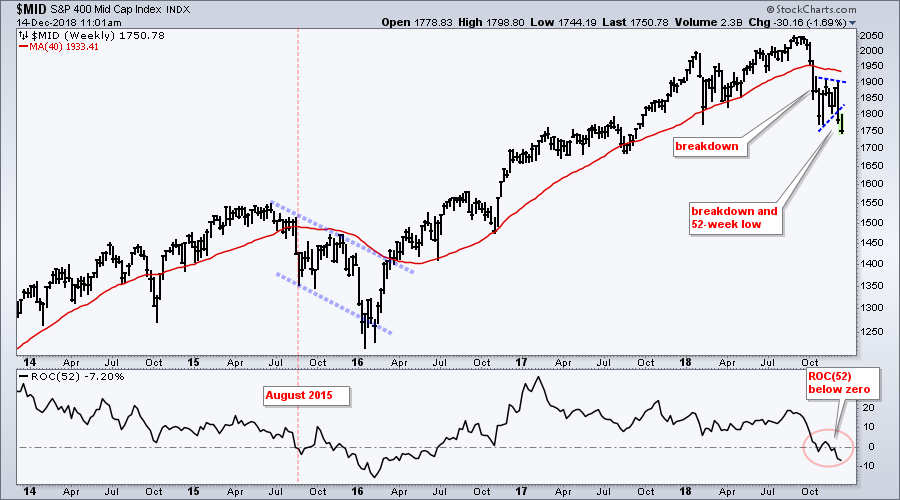
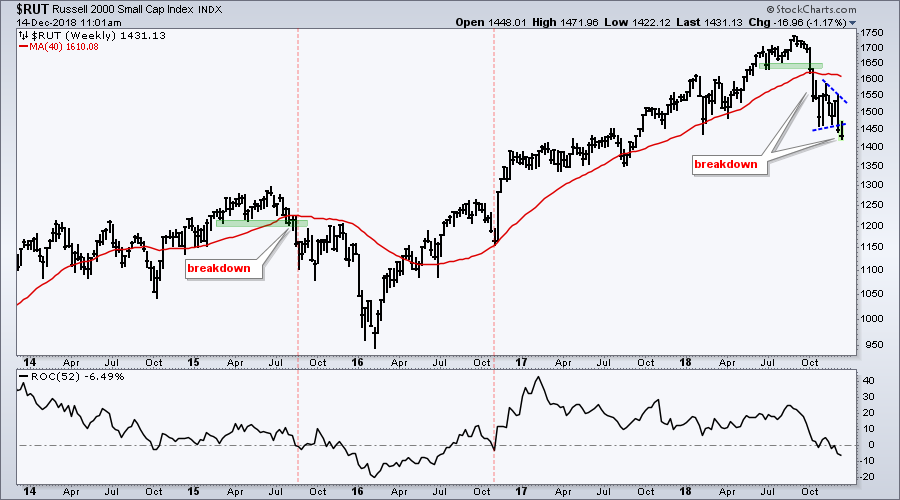
The S&P Mid-Cap 400 and the Russell 2000 are faring even worse than the S&P 500 brothers. $MID and $RUT broke down in October, consolidated for a few weeks and broke down again last week. Both moved lower again this week and hit 52-week lows. The 52-week Rate-of-Change is also negative for both indexes. Weakness in mid-caps, small-caps, the Home Construction SPDR (ITB) and the Retail SPDR (XRT) does not bode well for the economic outlook.
Bonds Catch Bid as Stocks Fall
The next chart shows the major index ETFs along with the inter-market ETFs (sans REITs). SPY, IJR and MDY broke triangle lines to signal a continuation lower. QQQ is holding up better, but still in a downtrend overall. Some of the tech-related ETFs are hold showing short-term relative strength (SKYY, IGV, HACK). Broad market risk remains, but these are the ones to watch if there is a bounce next week.
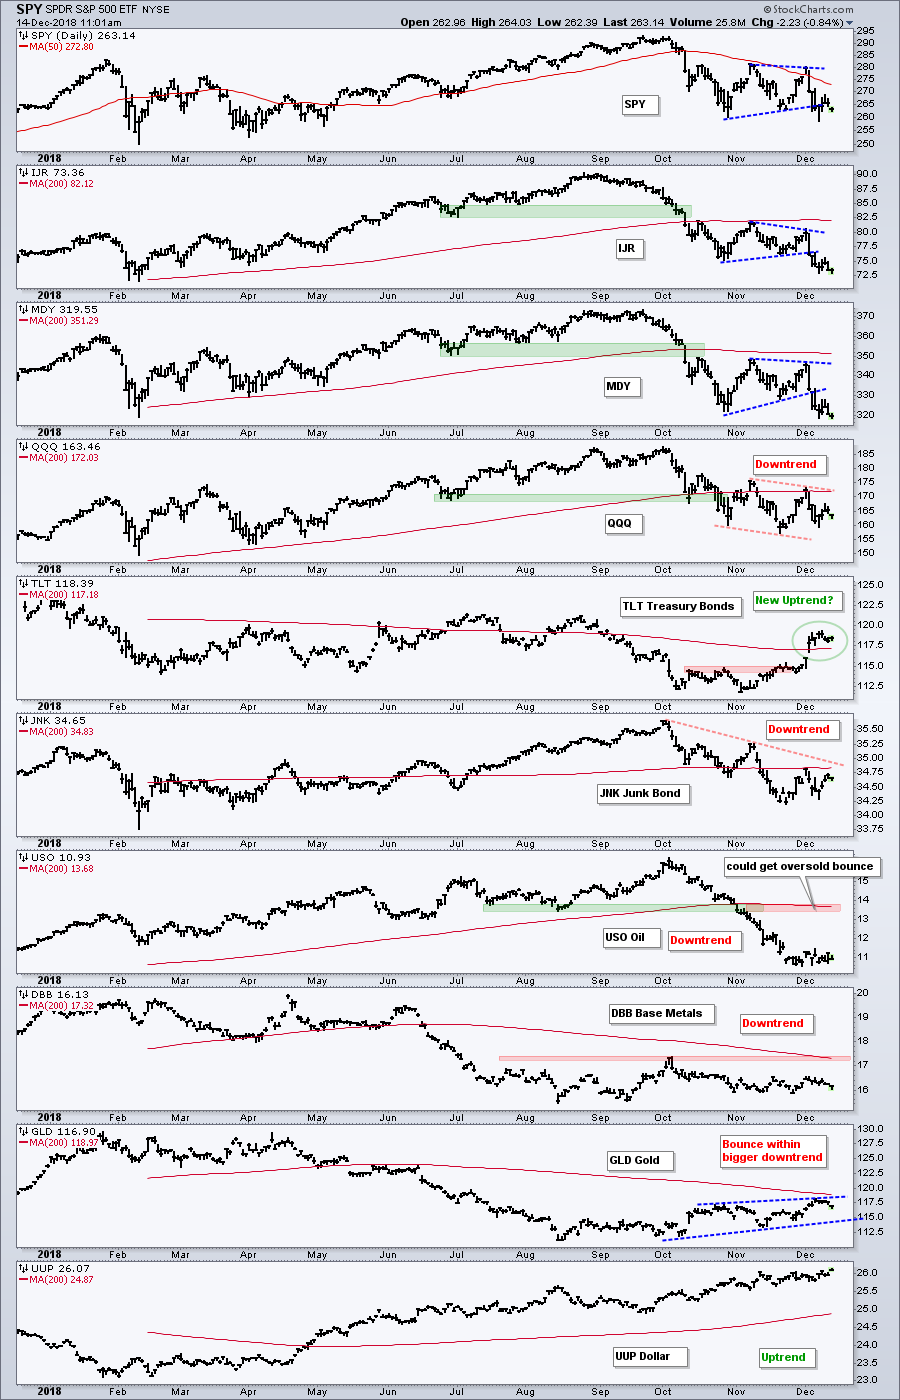
Weakness in stocks (risk assets) put a bid in the 20+ YR T-Bond ETF (TLT) as it moved above its 200-day SMA. The USO Oil Fund (USO) firmed over the last two weeks and could be setting up for an oversold bounce. Keep in mind that the bigger trend is down. The Base Metals ETF (DBB) flattened over the last few months, but also remains in a long-term downtrend. The Gold SPDR (GLD) edged higher over the last two months, but this is considered a counter-trend bounce. And finally, the Dollar is strong as UUP trades near 52-week highs.
10-yr Yield and Oil Fall Together
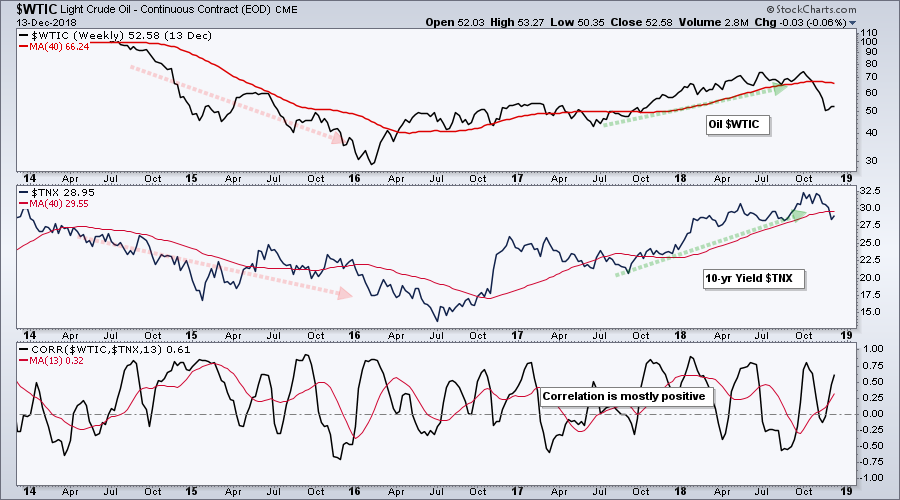
The 10-yr T-Yield ($TNX) fell back below 3% as the 20+ YR T-Bond ETF (TLT) moved above its 200-day. Yields typically fall when inflationary pressures ease and/or economic growth slows. The sharp decline in oil from October to November eases inflationary pressures, while the sharp decline in stocks points to slowing economic growth. The chart below shows that the 10-yr yield and oil are positively correlated for the most part.
Gold Ignores Dollar Strength
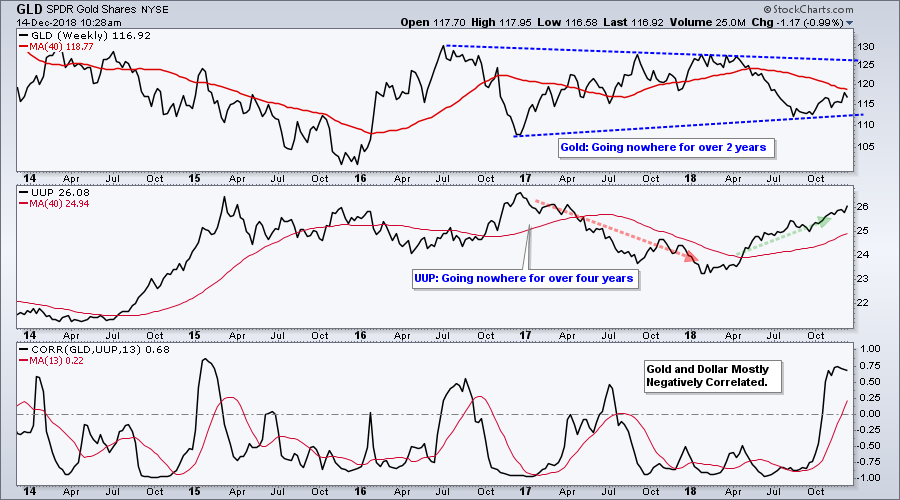
The Gold SPDR (GLD) has been working its way higher the last two months, but this is still just an upswing within a bigger trading range (at best). Note that GLD is trading at the same level it was in the summer of 2014. The Dollar is in a long-term uptrend, but it too has been range bound for several years. The relationship between gold and the Dollar changed over the last few weeks as the Correlation Coefficient moved to its highest level since early 2015. Gold and UUP have rarely been so positively correlated so I would not expect it to last long.
Is it Really Worth It?
The bulk of the evidence for the stock market turned bearish in mid October and most stock-related ETFs are down over the last 52 days (since October 1st). Even though a few are bucking the selling pressure, investors must ask themselves if the risk justifies the reward. Even owning defensive groups like utilities, staples and healthcare carries risk and investors need to be rewarded for bearing that risk.
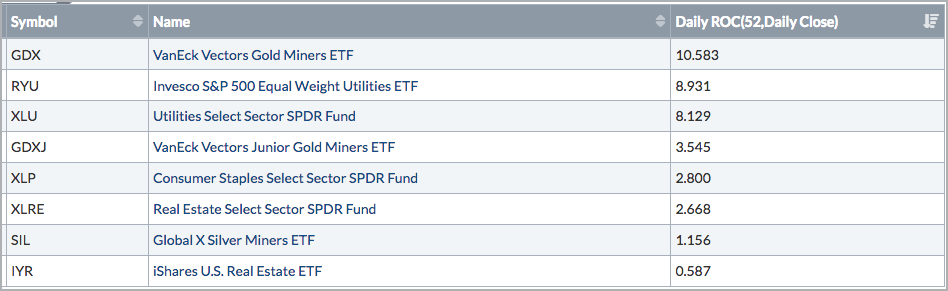
Over the last 52 days, note that eight of the nine equal-weight sectors are down and all nine small-cap sectors are down. Furthermore, seven of the eleven sector SPDRs are down. On a total return basis (including dividends), only the EW Utilities ETF (RYU), Utilities SPDR (XLU), Consumer Staples SPDR (XLP) and Real Estate SPDR (XLRE) have a positive Rate-of-Change over the last 52 days. The results are just as bad when scanning industry group ETFs. The Gold Miners ETF (GDX), Silver Miners ETF (SIL) and REIT iShares (IYR) are the only ones up since the beginning of October. The HealthCare Providers ETF (IHF) and Medical Devices ETF (IHI) are down less, but they are still down and not immune.
XLU Hits New High
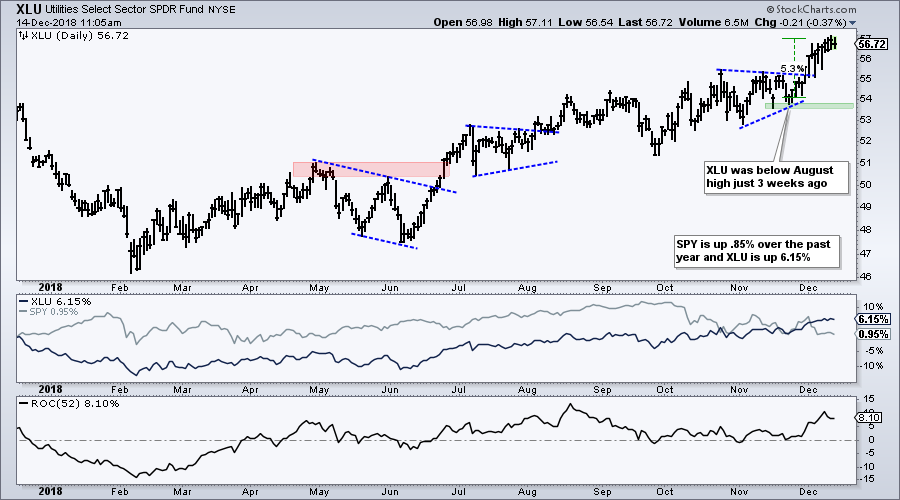
The chart shows XLU over the past year with one-year price performance in the first indicator window (SPY,XLU) and the 52-day Rate-of-Change in the lower window. XLU hit a new high with a 5.4% gain over the last 14 days. Prior to this move, XLU was pretty much unchanged year-to-date and trading below its October high. Even though XLU showed relative strength in late November, buying pressure did not pick up until December. Overall, the trend here has been up since late June and remains up with support marked in the 53.5 area. Despite this uptrend, investors must still ask the question: is the risk of owning stocks, even XLU, worth the reward?
XLP Corrects within Uptrend
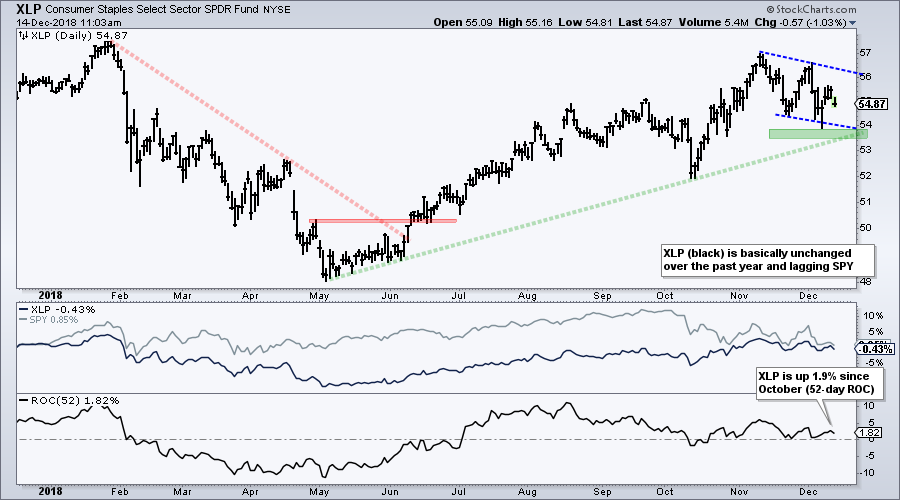
The next chart shows the Consumer Staples SPDR (XLP) with a 2.8% gain over the last 52 days. Even though the ETF is up sharply since May, it is still up less than SPY over the past year (.16% versus 1.3%). The overall trend remains up with a correction forming the last six weeks. Key support is set in the 53.5-54 area. I noted in Art's Charts on Wednesday that the consumer staples sector shows internal weakness with a recent surge in new lows. Thus, this sector does not look that safe.
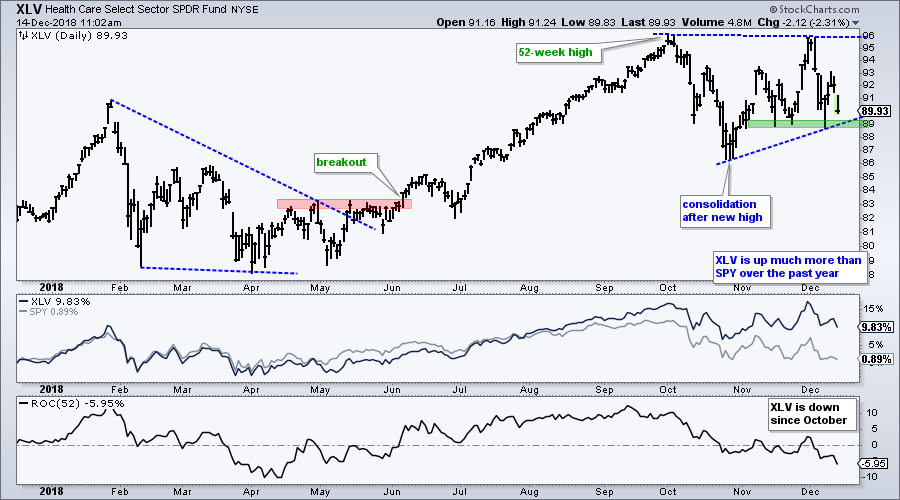
XLV Consolidates after New High
The next chart shows the Health Care SPDR (XLV) hitting a new high in early October and then moving into a trading range. This looks like a consolidation within a bigger uptrend at the moment. However, note that XLV is down 3.25% since October and not immune to broad market weakness. The November-December lows mark key support in the 89 area.
Notes from the Art's Charts ChartList
- The Home Construction iShares (ITB) is consolidating after hitting a new low in late October and this could be a bearish continuation pattern.
- The Retail SPDR (XRT) plunged below its November low and extended its downtrend.
- The Cloud Computing ETF (SKYY), Cyber Security ETF (HACK) and Software iShares (IGV) still have falling wedge patterns working, but reversed their upswings within these patterns. They still show relative strength from late November to early December though.
- The Broker-Dealer iShares (IAI) and Regional Bank SPDR (KRE) moved to new 52-week lows.
- The Airline ETF (JETS), Solar Energy ETF (TAN) and Transport iShares (IYT) broke rising wedge lines in December.
- The Biotech iShares (IBB) is consolidating after its October breakdown. The Biotech SPDR (XBI) reversed its upswing with a sharp decline the last five days.
- The HealthCare Providers ETF (IHF) and Medical Devices ETF (IHI) are still holding up better than the rest, but not immune to broad market weakness.
- Click here for the Art's Charts ChartList
Questions, Comments or Feedback?
I do not take symbol request and I cannot promise to response to all correspondence, but I will read it and take into under consideration. I greatly appreciate all feedback because it helps me improve the commentary and provides ideas for the future.

Plan Your Trade and Trade Your Plan.
- Arthur Hill, CMT
Senior Technical Analyst, StockCharts.com
Book: Define the Trend and Trade the Trend
Twitter: Follow @ArthurHill


