- A Bull Market in Noise.
- New Lows Expand.
- Another Week and Another Big Swing..
- NDX Holds Up Better.
- Stocks Holding the 200-day.
- SKYY, HACK and IGV Trace Out Wedges.
- Healthcare Remains the Leader.
- REM, IHI and IHF Hold Up.
- Notes from the Art's Charts ChartList.
 ... A Bull Market in Noise ...
There sure is a lot of noise out there, and I am not just talking about the charts. Outside the charts, we are hearing about trade wars, tariffs, inverted yield curves, Fed speak, the Fed balance sheet, employment, Brexit, OPEC, Huawei and more. There is certainly lots of blame to go around. Inside the charts, we are seeing higher levels of volatility as the major stock indexes churn after their breakdowns, which occurred in mid October.
Guess what? Volatility and noise are par for the course after a breakdown or change in the market environment. As far as I am concerned, the market environment changed from bullish to bearish with the plunge in mid October. Trading since this change has been volatile as bulls and bear slug it out, but these bearish signals have yet to be reversed. At best, the market environment is "not bullish" and we could see a choppy range, like in the second half of 2015. At worst, sellers could maintain their edge and drive prices lower.
The broad market environment is, perhaps, the single most important consideration when investing or trading stocks. A bull market environment provides the best conditions for making money on the long side. A bear market environment carries above average risk because the majority of stocks decline, hence the bear market. Personally, I am not interested in short positions and prefer to simply raise cash in such situations. At the very least, I would be very selective. The "not bullish" environment may be the worst because neither bulls nor bears seem to have a clear edge, and everybody loses.
There are still pockets of strength in the stock market, but the weight of the evidence remains bearish. Healthcare, utilities, REITs, medical devices, healthcare providers and mortgage REITs remain the bright spots. Despite some pockets of strength, seven of the eleven sectors SPDRs are below their 200-day SMAs, and the 50-day SMAs are below the 200-day SMAs for six of the eleven.
New Lows Expand
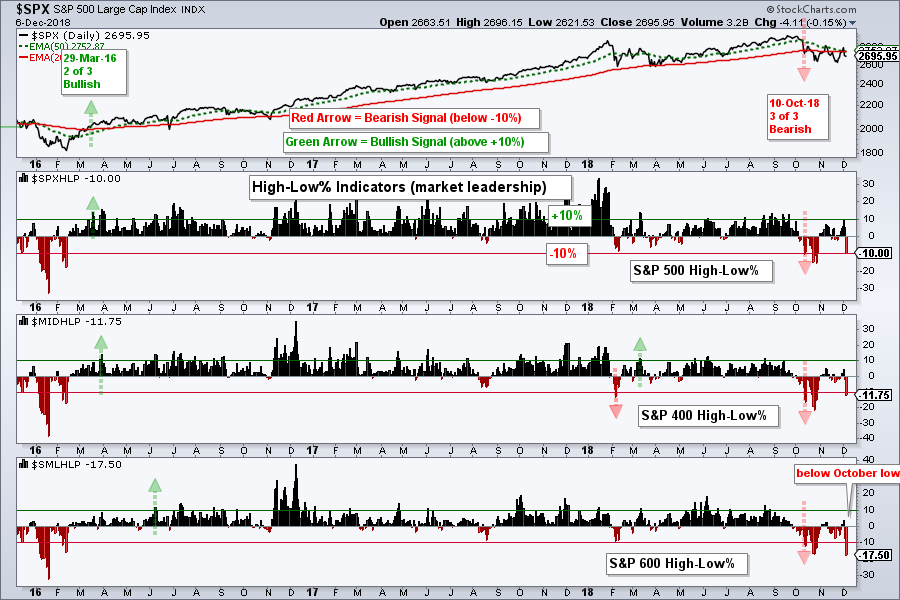
This week's selling pressure pushed the High-Low Percent indicators to -10% or lower for the S&P 500, S&P Mid-Cap 400 and S&P Small-Cap 600. Small-caps led as High-Low Percent dipped to -17.5% and exceeded its October low. These numbers show an expansion in new lows and stocks hitting 52-week lows are in long-term downtrends. The broad market environment cannot be classified as bullish when 10% or more of the index components are hitting new lows.
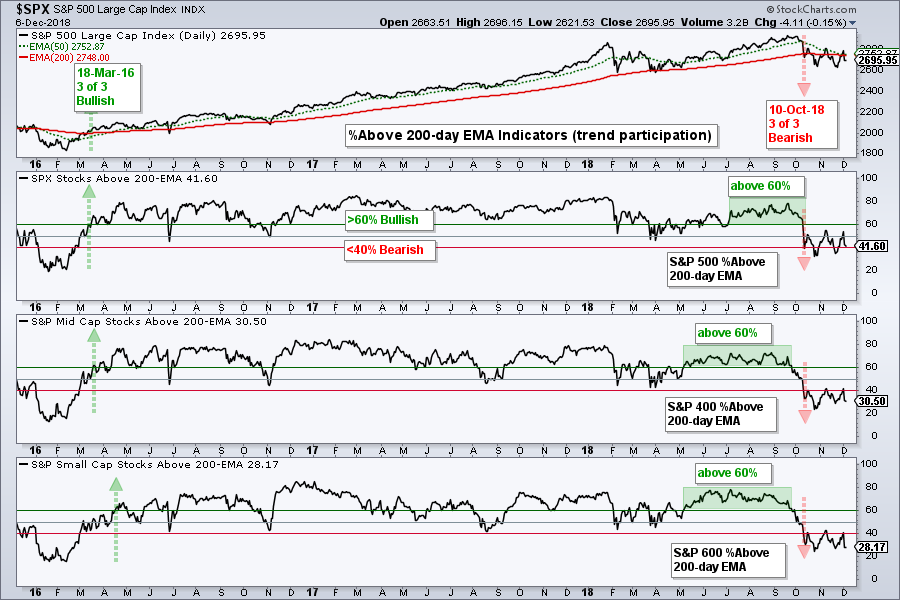
The next chart shows the percentage of stocks above the 200-day EMA remaining at low levels. Large-caps are holding up better because 41.6% of S&P 500 stocks are below their 200-day EMAs. In contrast, just 30.5% of mid-caps and 28.2% of small-caps are above their 200-day EMAs. This means around 70% of stocks in the S&P Mid-Cap 400 and S&P Small-Cap 600 are below their 200-day EMAs and in long-term downtrends.
Another Week and Another Big Swing
Maybe the title should read: another week and another big swig (of whiskey). Yep, I picked a bad week to quit drinking. The next chart shows the S&P 500 breaking down in October and turning volatile after this breakdown (blue outline). The index crossed its 200-day SMA nine times since mid October with the latest cross coming to the downside. The 50-day SMA moved sharply lower the last few weeks and is less than 2 points above the 200-day SMA. The death cross looms, but this is a moot point because the bulk of the evidence turned bearish in mid October.
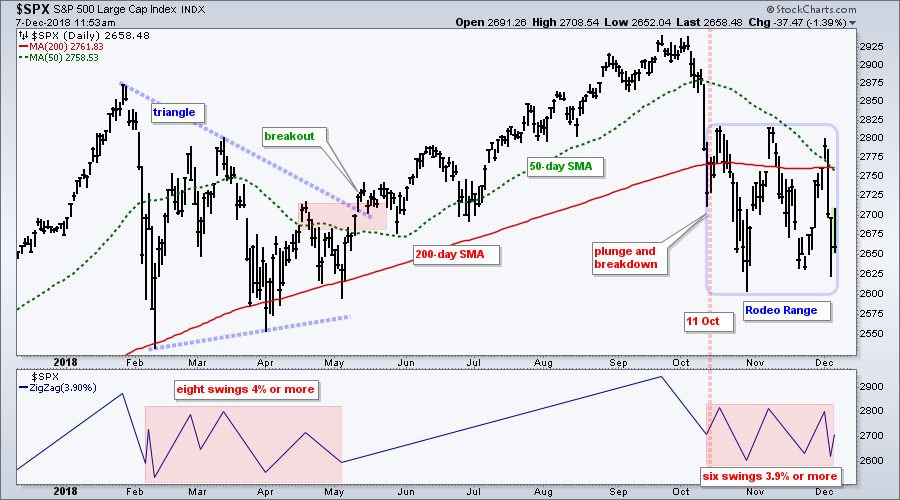 The indicator window shows the Zigzag indicator (3.90%) to capture swings that were 3.90% or more (call it 4 if you want). There have been six such swings since the mid October breakdown and this confirms what we already know. Volatility is above average and this means risk is above average. Trade accordingly.
NDX Holds Up Better
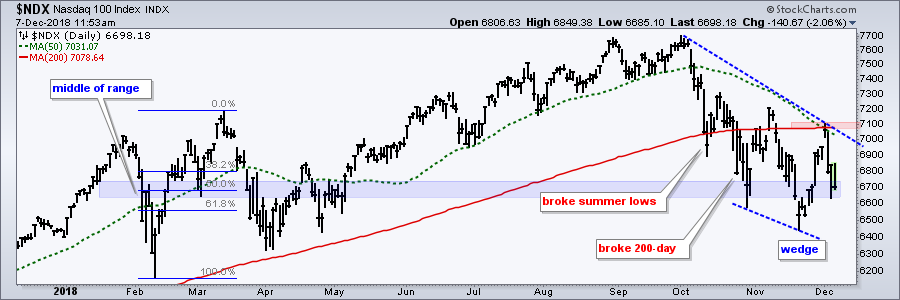
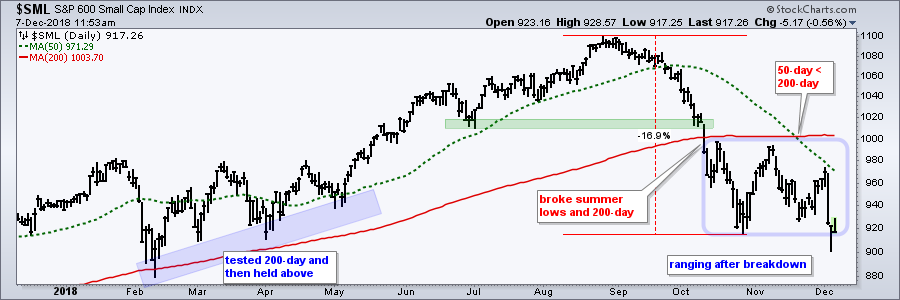
In the midst of all this doom and gloom, I am noticing a little less weakness (relative strength) in the Nasdaq 100. Let's not read too much into it right now, but keep an eye on it. The S&P 500 and S&P Mid-Cap 400 moved below their late November lows, while the S&P Small-Cap 600 moved below its October low. $SML is the weakest of the four, while $NDX is the least weak. The chart shows $NDX testing the 6700 area this week as a wide falling wedge takes shape. A move above 7100 would break the wedge line and resistance from this week's high (and the 200-day SMA). Should stocks recover and mount a yearend rally, $NDX is the one to watch for leadership.

A Few Stocks Holding the 200-day
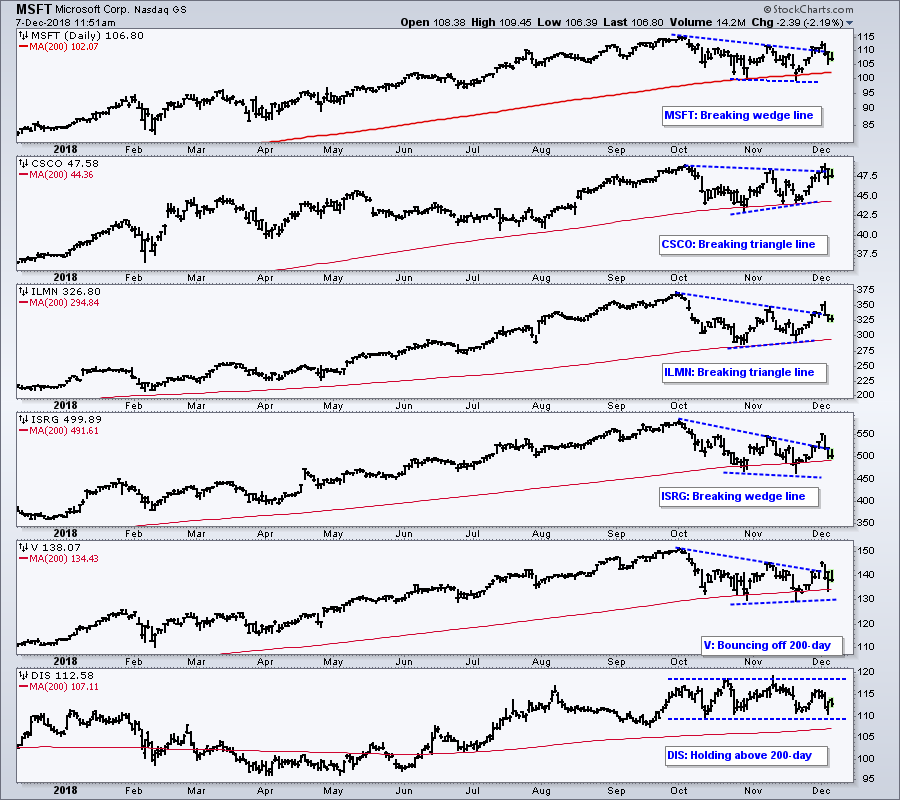
Chartists looking for stocks that are still holding up simply need to watch the 200-day SMA. Stocks that held the 200-day SMA over the last three months show relative chart strength and are outperforming most other stocks. There are also some big names in this group. The chart below shows six such names with either falling wedge patterns or triangles. CSCO is the strongest of all because it is the closest to a new high.
SKYY, HACK and IGV Trace Out Wedges
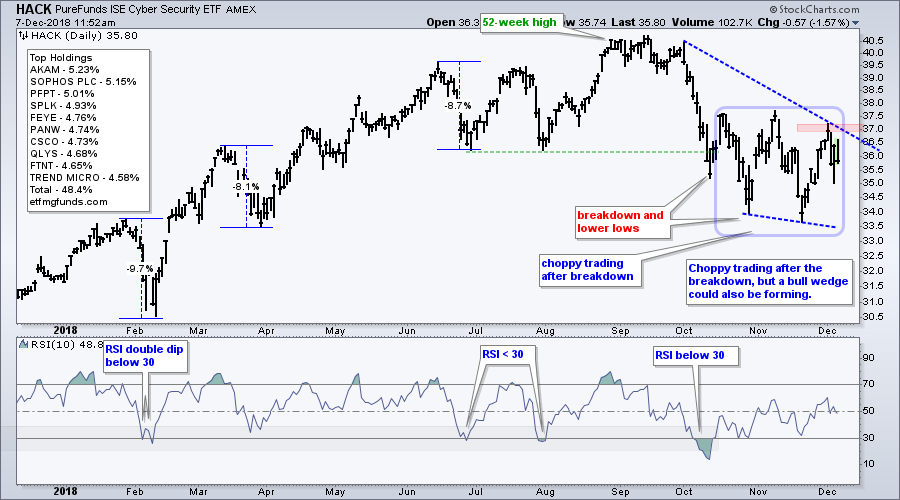
The Cloud Computing ETF (SKYY), Cyber Security ETF (HACK) and Software iShares (IGV) are holding up better over the last two weeks. While SPY dipped below its late November low this week, these three held above their late November lows and have falling wedge patterns working. The red zones mark resistance and breakouts by all three would be bullish for the tech sector, and QQQ. Remember: No breakout, no reversal.


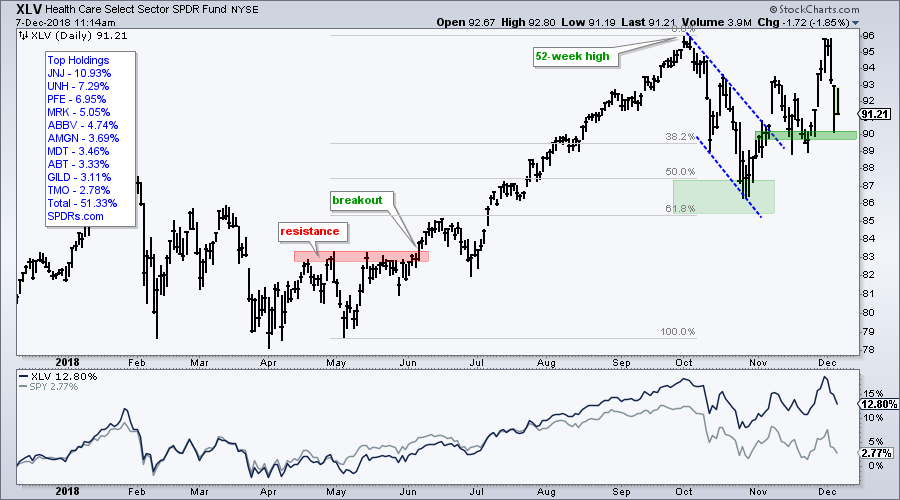
Healthcare Remains the Leading Sector
The Utilities SPDR (XLU), Real Estate SPDR (XLRE), Consumer Staples SPDR (XLP) and Health Care SPDR (XLV) are the only four sectors in uptrends at the moment. XLV is the leader of leaders. The ETF is up around 12.8% year-to-date, while SPY is up 2.8%. XLV broke out of a falling wedge in mid November, tested the breakout with a pullback to 90 and surged to the mid 90s. Even though XLV dipped below 91 with Thursday's volatility, it is still the strongest sector overall.
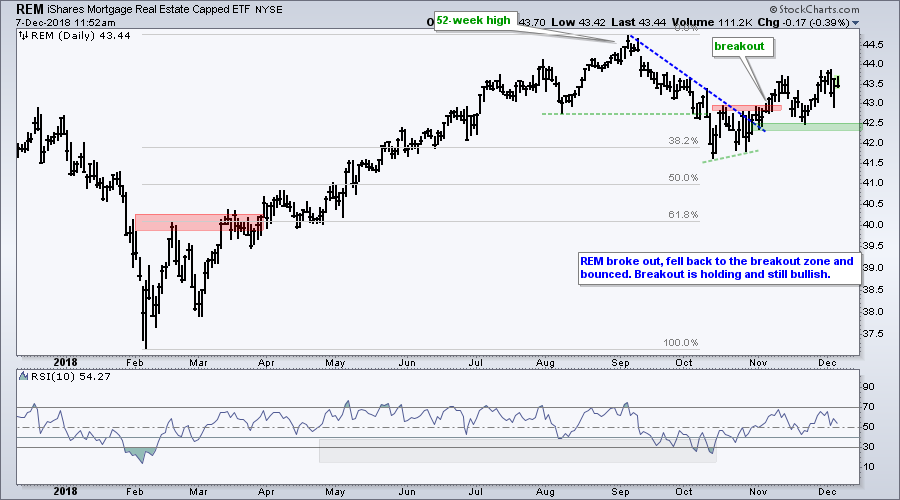
REM, IHI and IHF Hold Up
The Mortgage REIT ETF (REM), Medical Devices ETF (IHI) and HealthCare Providers ETF (IHF) held up relatively well during recent turmoil. REM broke out with an advance in mid November, tested this breakout zone in late November and bounced the last two weeks.
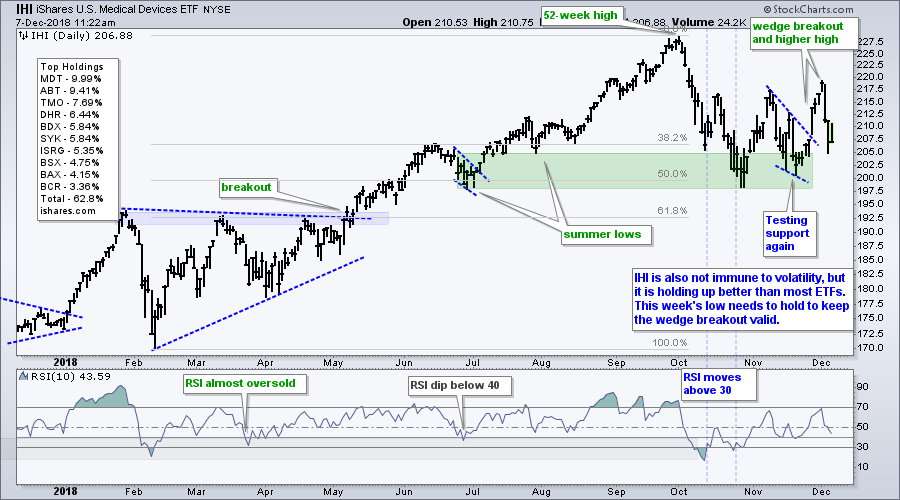
 IHI broke out of a small wedge last week and exceeded its mid November high this week. The ETF held up well in November and showed some relative strength here in early December. Thursday's low marks first support, a break of which would negate the wedge breakout.
 IHF turned volatile the last two months, but the pattern still looks like a big consolidation within a bigger uptrend. IHF appeared to break out on Monday, but fell back with market volatility and tested the lower boundary. Despite the failed breakout, the triangle is still there and remains a bullish continuation pattern.

Notes from the Art's Charts ChartList
- The Home Construction iShares (ITB) fund support over the last eight weeks, but remains in a downtrend over the last eight months.
- The Retail SPDR (XRT) broke below its October low in November and retail is not hot.
- The Cloud Computing ETF (SKYY), Cyber Security ETF (HACK) and Software iShares (IGV) stand out within the tech sector because they have falling wedges working. Watch the December high for a breakout.
- The Broker-Dealer iShares (IAI) hit a new low this week and the Regional Bank SPDR (KRE) fell over 5% on Tuesday.
- The Mortgage REIT ETF (REM) held up well over the last few weeks and the early November breakout is holding.
- The REIT iShares (IYR) is still leading and closing in on its summer highs.
- The Transport iShares (IYT) reversed near the 61.8% retracement and broke a wedge trend line.
- The HealthCare Providers ETF (IHF) is not immune to broad market weakness, but it remains within a large triangle consolidation.
- The Medical Devices ETF (IHI) fell back the last two days, but the wedge breakout is largely holding.
Questions, Comments or Feedback?
I do not take symbol request and I cannot promise to response to all correspondence, but I will read it and take into under consideration. I greatly appreciate all feedback because it helps me improve the commentary and provides ideas for the future.

Plan Your Trade and Trade Your Plan.
- Arthur Hill, CMT
Senior Technical Analyst, StockCharts.com
Book: Define the Trend and Trade the Trend
Twitter: Follow @ArthurHill


