- Three Gaps in the Same Place for SPY.
- What's Up with Bonds and Utes?
- Strange Happenings on the Yield Curve.
- Finance and Industrials are Still Laggards.
- On Trend on Youtube.
 ... Internal Strength on Big Bounces ...
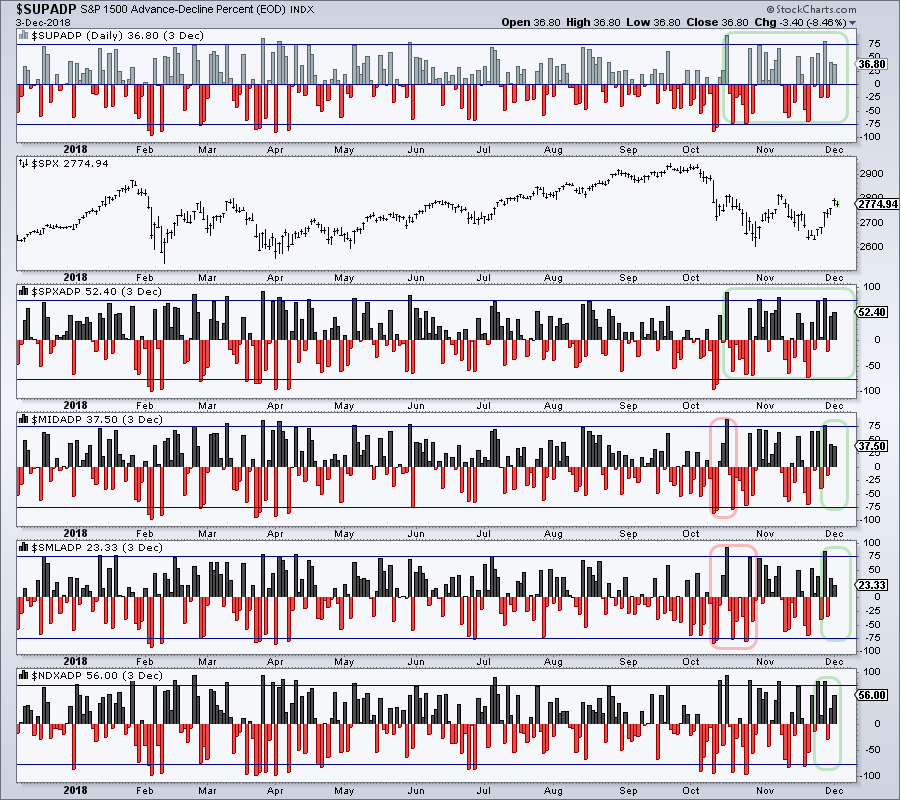
Monday's surge was impressive when looking at the change from Friday's close, but intraday price action and breadth were not impressive. AD Percent for the S&P 1500, S&P Mid-Cap 400 and S&P Small-Cap 600 was below 40% and below Friday’s levels. AD Percent equals advances less declines divided by total issues. This indicator shows net advances as a percentage of total stocks in the index. It is positive when advances outnumber declines and negative otherwise.
The chart below shows AD Percent for five major indexes with horizontal lines at +75% and -75%. These are thresholds that reflect strong upside participation and strong downside participation. All five indicators moved above +75% in late November, but not one exceeded +60% on Friday or Monday. In fact, S&P MidCap AD Percent ($MIDADP) finished at +37.5% and S&P SmallCap AD Percent ($SMLADP) finished at +23.33%. There were more advances than declines, but participation was certainly not broad.
Three Gaps in the Same Place for SPY
The next chart shows SPY with candlesticks over the last six months. Notice that SPY gapped above 276 on October 16th, November 7th and December 3rd. The first two gaps did not hold as the index turned down a few days later. Perhaps the third gap will be the lucky charm, but chartists should watch this gap closely because resistance is nigh. A close back below the gap would be negative.
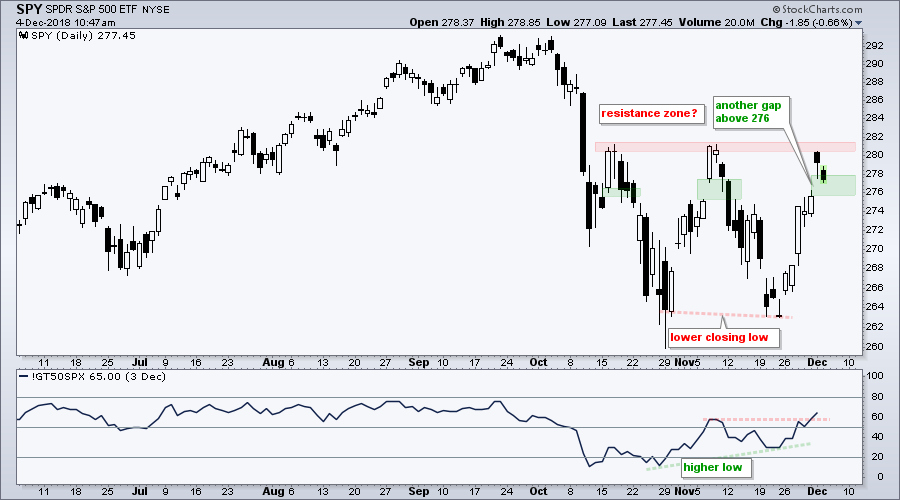
The indicator window shows S&P 500 %Above 50-day EMA (!GT50SPX) forming a higher low as SPY closed with a lower low from late October to late November. This divergence and the ability to hold above 20% mean fewer stocks participated in the second dip. The indicator moved above 50% with the late November surge. This is positive - as long as Monday's gap holds.
What's Up with Bonds and Utes?
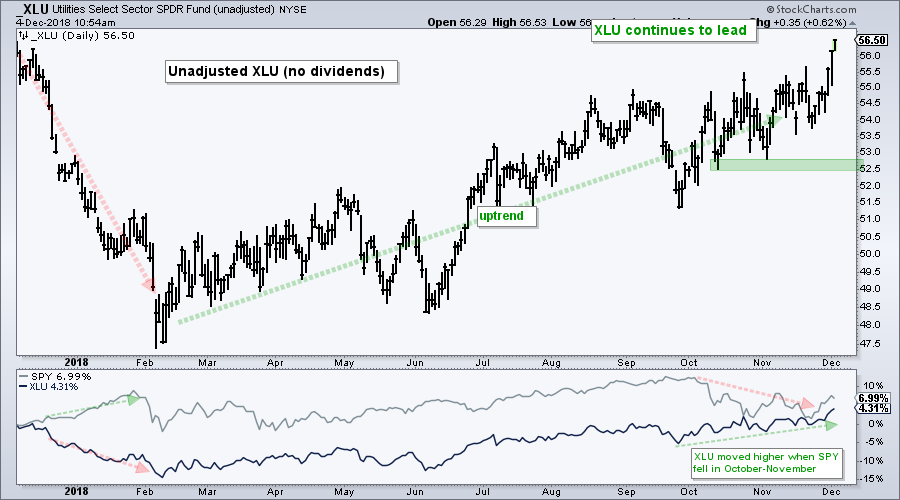
Stocks and oil surged on Monday as the markets moved to risk-on mode, but the 7-10 YR T-Bond ETF (IEF) and Utilities SPDR (XLU) did not get the memo. Even though all sectors moved higher on Monday, only XLU and Real Estate SPDR (XLRE) moved above their November highs. In fact, these two hit new highs for the year and remain the leaders overall.
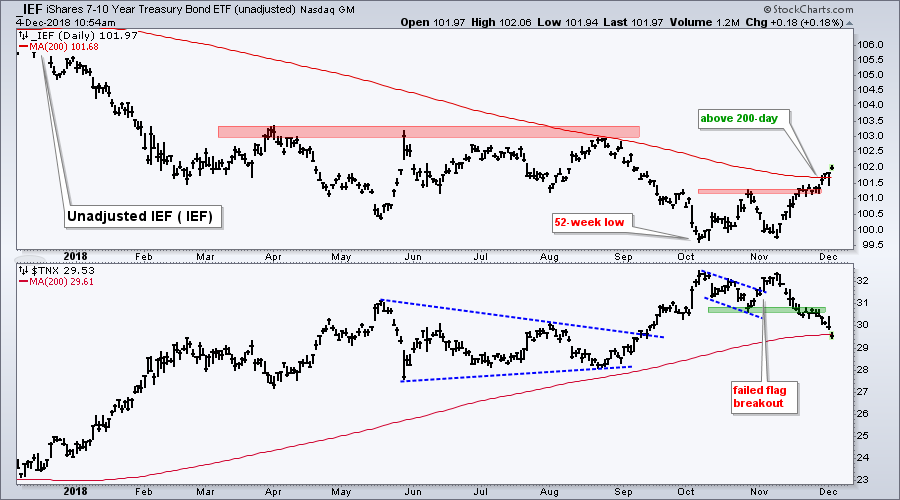
The next chart shows the unadjusted 7-10 YR T-Bond ETF (IEF) moving above its 200-day SMA for the first time this year. In addition, the 10-yr T-Yield ($TNX) moved below its 200-day SMA for the first time this year. Money is moving into bonds for some reason. It could an adjustment in Fed policy, a deteriorating economic outlook, lower inflationary expectations, a flight to safety or some combination.
Strange Happenings on the Yield Curve
The next chart shows five different Treasury yields and two yield curve indicators. While the yield curve is still positive, notice that the 2-yr T-Yield ($UST2Y) and 5-yr T-Yield ($UST5Y) are equal. The 5-yr yield should be higher than the 2-yr Yield and this is not normal. The curve is not inverted, but it is not normal.
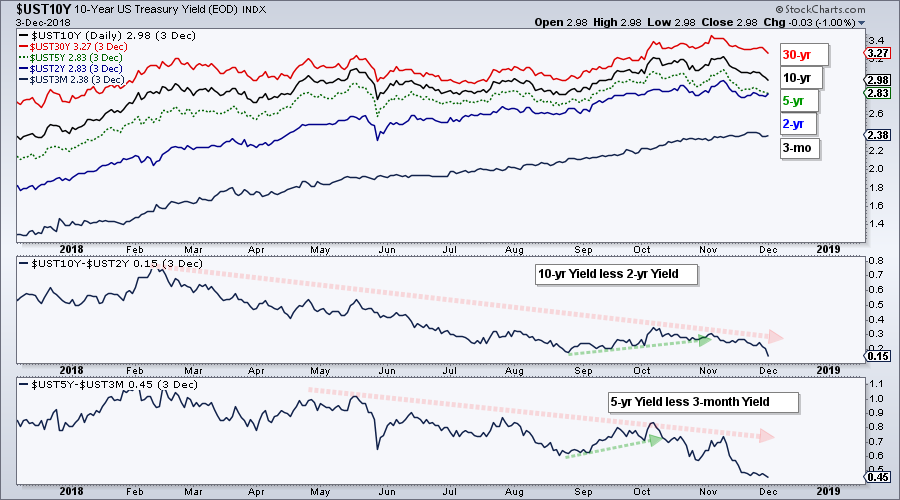
The indicator window shows the 10-2 yield curve edging higher from late August to early October and then turning lower. The yield curve is still positive, but it is the "least" positive its been this year.
Finance and Industrials are Still Laggards
Even before today's decline, the Financials SPDR (XLF) was one of four sector SPDRs showing a year-to-date loss. The Industrials SPDR (XLI) is also down year-to-date. Overall, it is hard to have a bull market when these two sectors are down in absolute terms and lagging.
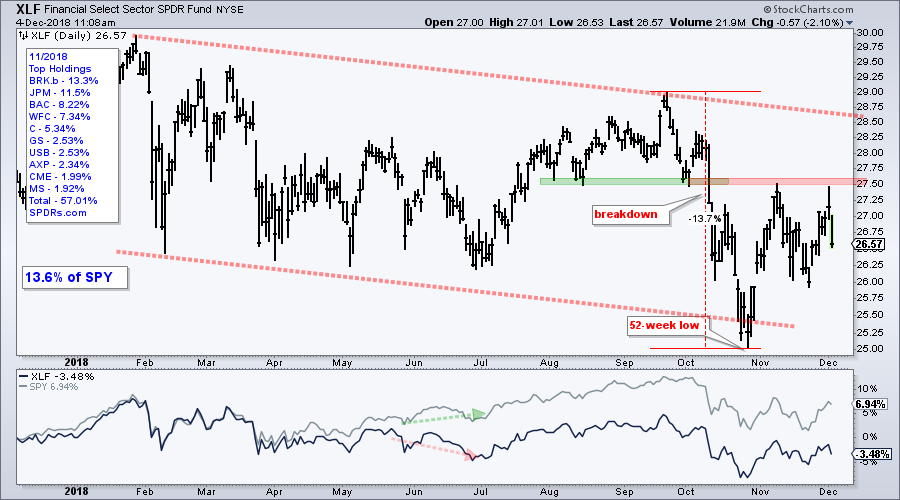
The next chart shows XLF hitting resistance near the support break in the 27.50 area. The ETF did not perform well during Monday's advance as it closed in the lower half of its high-low range. XLF is leading the market lower today. Don't forget that XLF hit a 52-week low in October and the big trend is down.
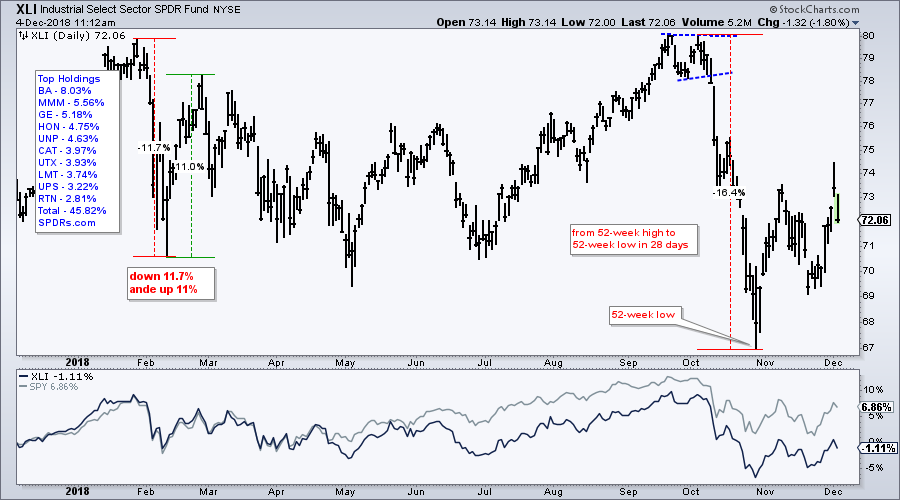
XLI also recorded a 52-week low in October. In fact, the ETF went from a 52-week high to a 52-week low in less that six weeks. Such a move is not normal for an uptrend or a bull market. The big trend is flat at best and down at worst. Bottom Line: XLF and XLI, two big important sectors, are NOT on trend.
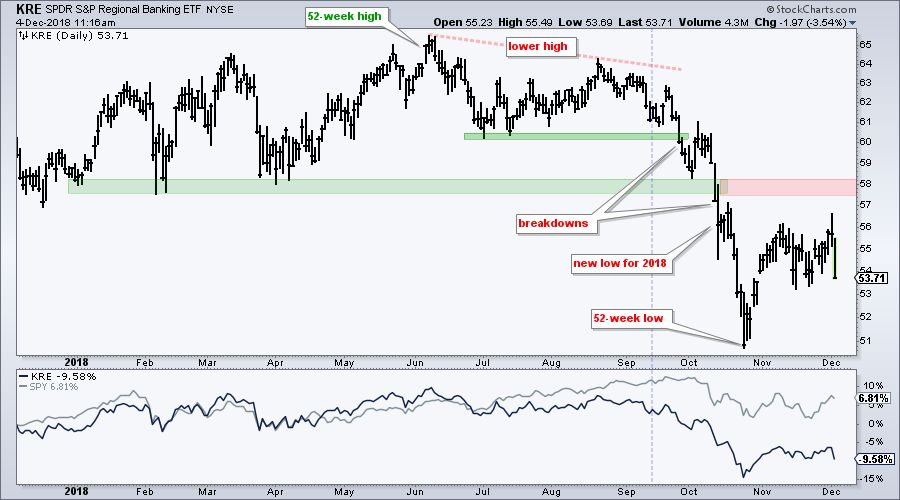
The next chart shows the Regional Bank SPDR (KRE) getting clobbered today with a 3+ percent decline. Something is rotten in the kingdom of banks.
On Trend on Youtube
If you did not catch On Trend on StockChartsTV today, you can watch a rerun later today at 5:30PM and 10PM ET, or tomorrow at 10:30AM. Alternatively, the show will be available on our Youtube channel later today. Here are the topics covered.
- Measuring Internal Strength on Big Bounces.
- Mind the Gaps and Resistance (SPY,QQQ,MDY,IJR).
- Abnormal Happenings in the Bond Market (plus XLU).
- Finance-related Groups Lagging (plus 8 stocks).
- FAANG Versus Non-FAANG.
- SMA vs EMA and Stocks to Watch.
- Click here for On Trend on Youtube.
- Arthur Hill, CMT
Senior Technical Analyst, StockCharts.com
Book: Define the Trend and Trade the Trend
Twitter: Follow @ArthurHill


