- XLF Goes from Leader to Laggard.
- XLF Hits Resistance and Retracement.
- Bollinger Band Squeeze Chart.
- Bollinger Band Squeeze Scan Code.
- On Trend on StockChartsTV
...XLF Goes from Leader to Laggard
...The Financials SPDR (XLF) went from leader to laggard over the last six weeks as the broad market advance narrowed. XLF led the market from December 24th to January 18th with a 12.15% gain and then lagged with a +.23% gain the last twelve days. The first PerfChart shows seven of the eleven sectors surging 7% or more from late December to mid January. This was a broad advance that lifted most boats.
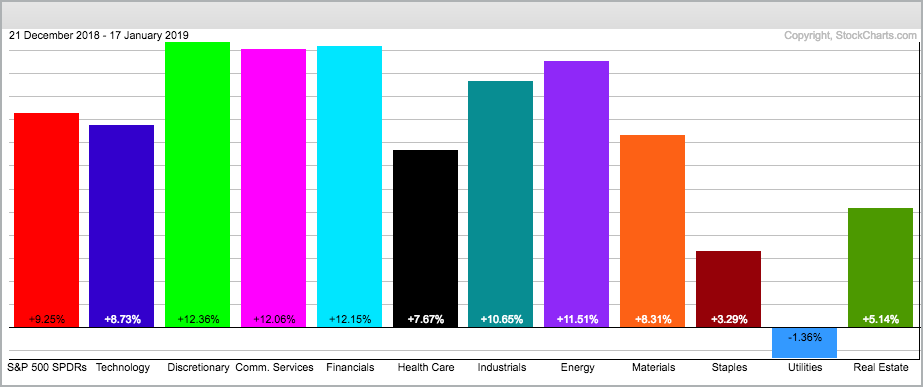
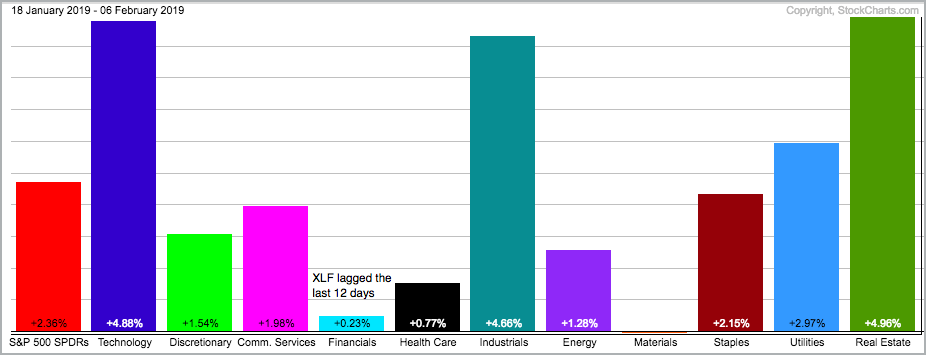
The second Perfchart shows lopsided performance over last twelve days. This suggests that the advance narrowed and could lead to a correction. XLF and the Materials SPDR (XLB) are barely positive, while the Consumer Discretionary SPDR (XLY), Communication Services SPDR (XLC) and Health Care SPDR (XLV) are up less than SPY (lagging). Basically, the Technology SPDR (XLK), Industrials SPDR (XLI) and Real Estate SPDR (XLRE) carried the market.
XLF Hits Resistance and Retracement
Short-term relative weakness in the finance sector could be an issue because the ETF is at a potential reversal zone. The chart below shows XLF with clear support in the 26-26.5 area from March to early October and a breakdown in October and December. This broken support zone turns first resistance and the ETF is trading back in this zone. Also notice that the flattening 200-day SMA resides here and the bounce retraced around 61.8% of the prior decline. After a double digit surge off the December low, this is a good spot for some resistance and a correction, at the very least.
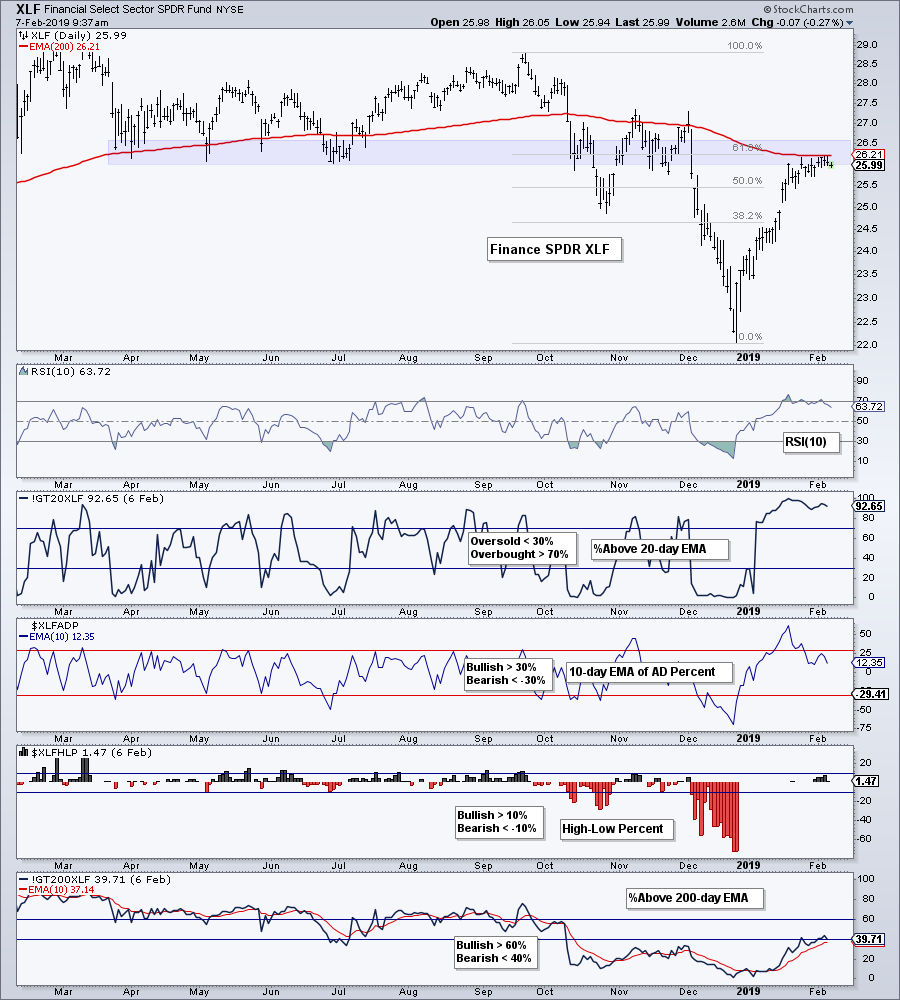
The indicator windows show breadth indicators that are unique to StockCharts. The Percentage of Stocks above the 20-day EMA (!GT20XLF) moved above 70% on January 4th and remains above this level. Watch for a move back below 70% to signal a downturn. The longer-term breadth indicators are still bearish. Notice that High-Low Percent for the sector ($XLFHLP) has not been above +10% since late September and the Percentage of Stocks above the 200-day EMA (!GT200XLF) remains near 40%. Less than half of the component stocks are in long-term uptrends.
Bollinger Band Squeeze
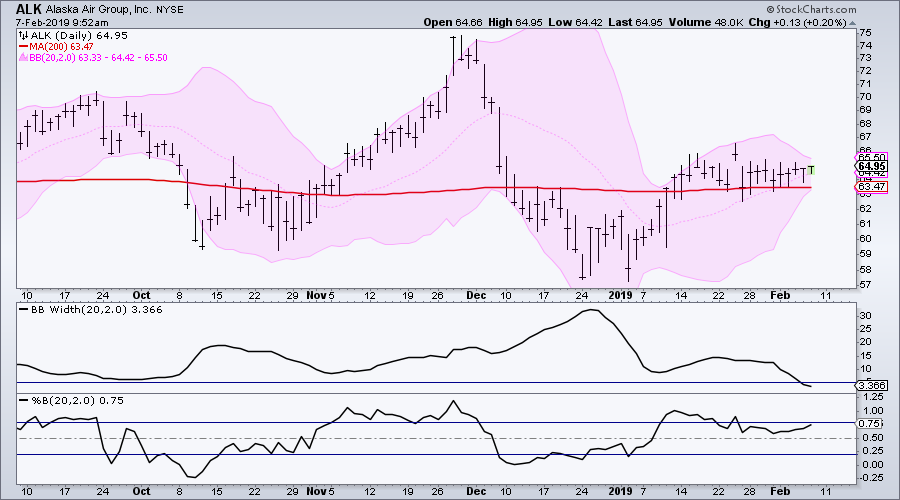
On Trend on StockChartsTV will show how to chart, scan and analyze the Bollinger Band squeeze. This shows airs on Tuesday and Thursday at 10:30AM and 11:00 AM. The chart below show Alaska Air (ALK) with the Bollinger Bands narrowing, BandWidth moving below 5% and %B trading between .80 and .20. The stock is just above its 200-day and a break above the upper band would be bullish. Note that %B moves above 1 when price moves above the upper band.
Scan Code
[group is SP500] or [group is SP400] or [group is SP600]
and [SMA(1,close) > SMA(200,close)]
and [Min(1,BB Width(20,2)) < 5]
and [%B(20,2) < .8]
and [%B(20,2) > .2]
On Trend on YouTube
The Moment and the Squeeze
- The Moment of Truth Arrives for Stocks
- XLF Stalls Out (Plus JPM, BAC, WFC, GS, MS)
- Careful with ITB (Plus DHI, HD, LEN, PHM)
- Chart and Scan the Bollinger Band Squeeze
- 5 Squeeze stocks: ALK, BIIB, DIS, LYV, WBA
- Click here to Watch
- Arthur Hill, CMT
Senior Technical Analyst, StockCharts.com
Book: Define the Trend and Trade the Trend
Twitter: Follow @ArthurHill


