The Broker-Dealer iShares (IAI) led the market rebound from December 24th to January 18th and then stalled out over the last two weeks.
As with the broader market, we can see two conflicting trends. The long-term trend is down because IAI hit a 52-week low in late December, remains below its last peak (early November) and remains below the falling 200-day SMA.
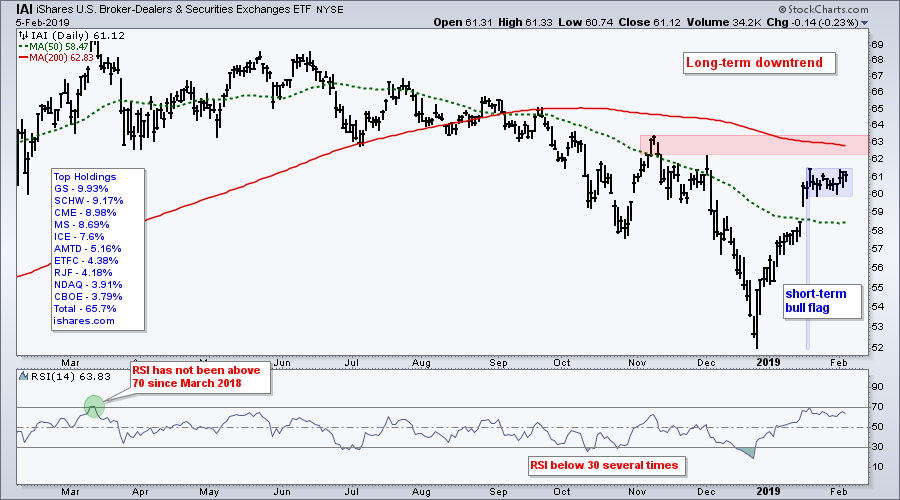
Short-term, IAI surged over 10% and then formed a consolidation that looks like a flat flag. Here's the tricky part. A flag after a sharp surge is a short-term bullish continuation pattern, but the long-term trend is down and this is still the dominant force at work. Either way, the risk of whipsaw and directionless trading appears high.
Short-term, chartists can watch the flag boundaries for the next directional clue. A break above 61.5 would be bullish and a break below 60 would be bearish.
Goldman, Morgan and Schwab Stall
The IAI chart above shows the top ten components for reference. The next three charts show short-term consolidation patterns to watch going forward.
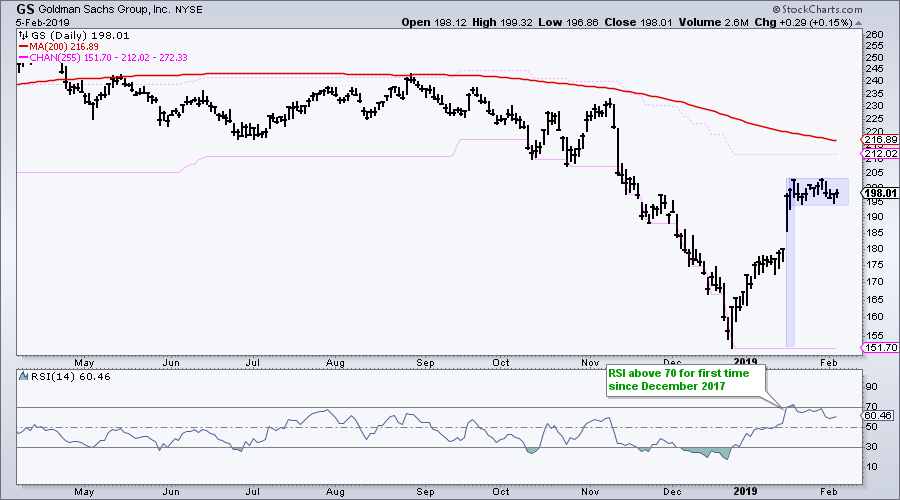
The first chart shows Goldman Sachs (GS) with a high and tight flag. GS is also in a long-term downtrend, but RSI moved above 70 for the first time since December 2017. This shows strong upside momentum that could foreshadow a bigger trend reversal.
Short-term, there are two possible plays here. A flag break to the upside would be bullish and argue for further strength. A flag break to the downside would be negative and argue for a pullback to the 175-180 area or even a retest of the December low.
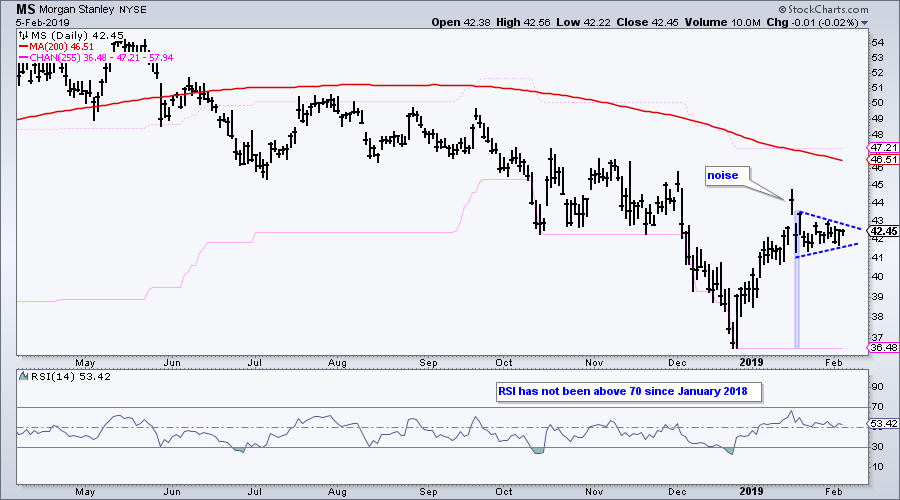
The next chart shows Morgan Stanley (MS) in a long-term downtrend with a new low in late December and price well below the falling 200-day SMA. RSI has not been above 70 since January 2018. The stock surged with the rest of the market and then consolidated with a triangle/pennant. I consider the spike above 44 as noise and choose to ignore it (fielder's choice). Watch 43 up and 41.5 down.
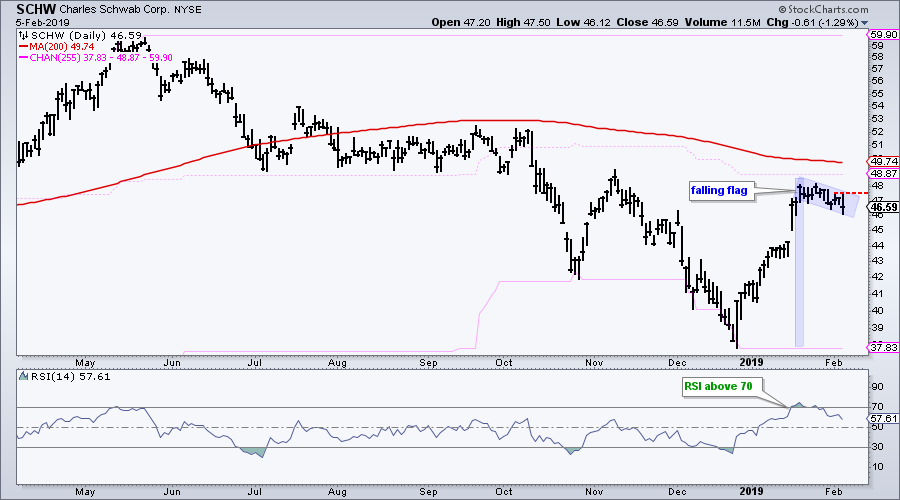
The last chart shows Schwab (SCHW) with a falling flag. Watch for a break above 48 to signal a continuation higher. Barring a breakout, the flag is falling and this is a short-term downtrend. Also note that the stock is lagging the S&P 500 over the last two weeks because the market moved higher during this period.
Other Charts on my Radar
On Trend on YouTube
To Chase or Not to Chase
- Reviewing the Turn of the Month
- Two Parts to an Uptrend (AMZN, CIEN)
- HACK and SKYY Lead Tech ETFs
- Six Healthcare Leaders (MRK, PFE, ABT...)
- Four Teetering Tech Titans (GOOGL, MSFT...)
- Stocks to Watch (ULTA, WING, TER...)
- Click here to Watch
- Arthur Hill, CMT
Senior Technical Analyst, StockCharts.com
Book: Define the Trend and Trade the Trend
Twitter: Follow @ArthurHill


