- SPX High-Low Percent Nears Signal Flip.
- Intuitive Surgical Breaks Out.
- Walgreens-Boots Bounces off 200-day.
- Careful with AMD.
- RSI Improvements in Intel.
... Five of the nine breadth indicators are on bearish signals right now, but S&P 500 High-Low% ($SPXHLP) reached 9.8% on Tuesday and is close to triggering bullish. A move above +10% would flip this indicator signal and turn the majority of indicators bullish (five of nine). The chart below shows all three triggering bearish on October 11th when they moved below -10% (red line). S&P 400 High-Low% ($MIDHLP) and S&P 600 High-Low% ($SMLHLP) are still well short of bullish signals.
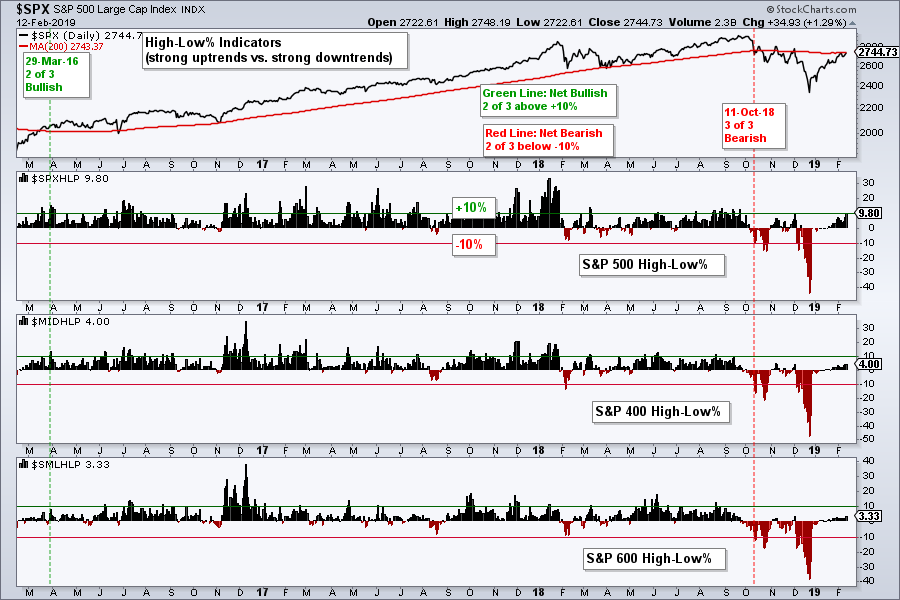
The High-Low Percent indicators represent the leading stocks in the three indexes. Stocks recording 52-week highs are in strong uptrends and leading the market. I look for this indicator to exceed 10% to show enough leadership to support a bull run. Technically, at least two of the three indicators need to trigger bullish to turn the group bullish. I will update all nine indicators in the Weekly Market Review and Outlook on Friday.
Intuitive Surgical Breaks Out
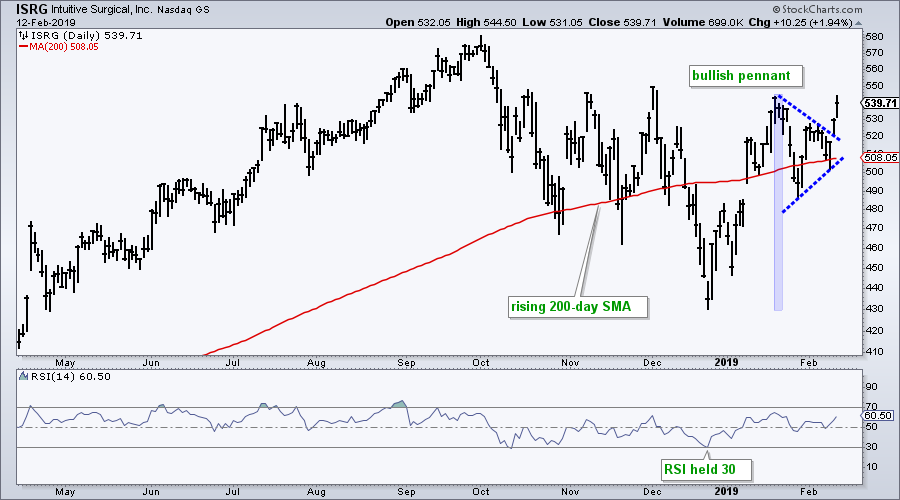
Intuitive Surgical (ISRG) was featured in On Trend on Tuesday. Despite a deep pullback into December, the stock appears to be in a long-term uptrend, especially when viewed on a weekly chart. The 200-day SMA is rising and the stock moved back above this moving average over the last few weeks. After a sharp surge in Dec-Jan, the stock formed a pennant into February and broke out of this consolidation over the last two days. Pennants are short-term continuation patterns and the prior move was up. Thus, this particular pennant is a bullish continuation pattern. The breakout signals a continuation of the prior advance with the September high marking the first target.
Walgreens-Boots Bounces off 200-day
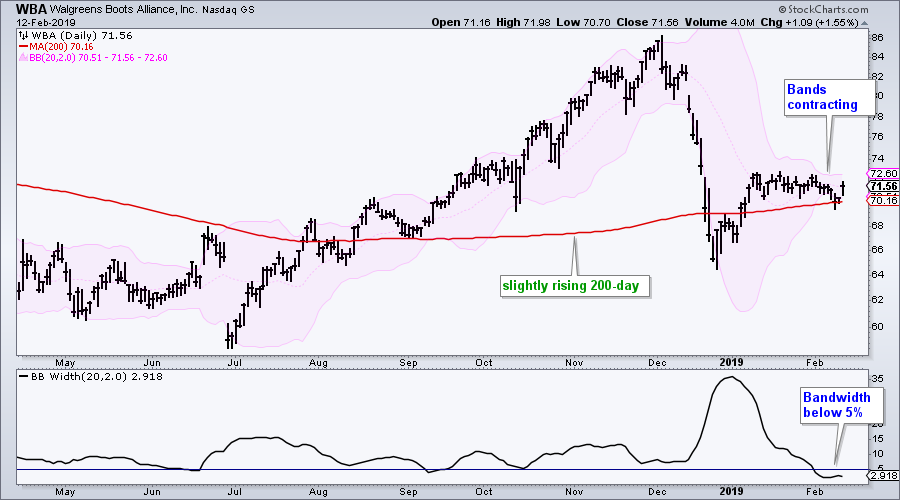
Walgreens-Boots (WBA) was featured in On Trend last Thursday with a Bollinger Band squeeze. This video also showed the scan code for a Bollinger Band squeeze. WBA is consolidating just above a slightly rising 200-day SMA. The stock broke below the lower band last Friday, but quickly rebounded with a nice bounce on Tuesday. In his book, Bollinger on Bollinger Bands, John Bollinger referred a "head fake" in which there is a false break one way before moving in the opposite direction. At this stage, WBA needs to break above the upper band for the next directional signal.
AMD Drags its Feet
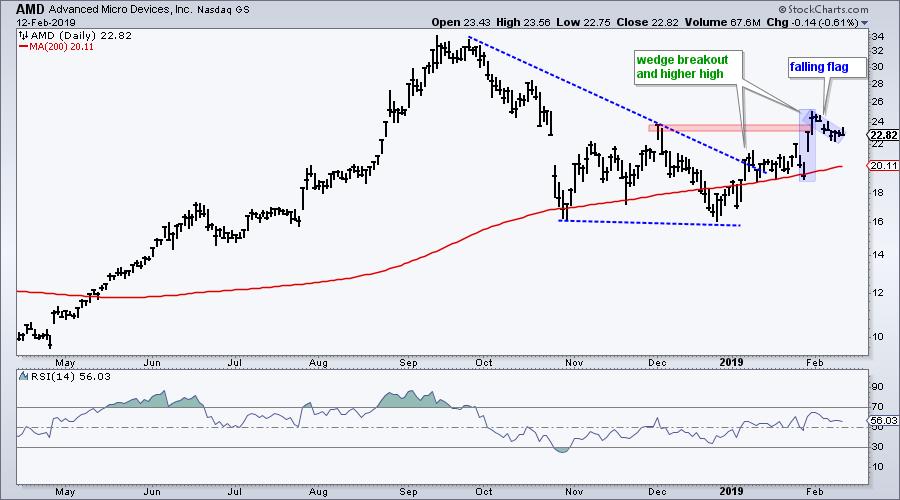
I also featured AMD with a bull flag in Monday's commentary. The S&P 500 was up 1.3% on Tuesday, the Semiconductor iShares (SOXX) surged 2.11% and AMD was down .61%. AMD remains above the rising 200-day and the higher high in early February is bullish. The bull flag remains possible, but the inability to bounce with the broader market and the industry group raises a yellow flag. A close below 22 would negate the flag and call for a reassessment.
RSI Range Improvements for Intel
In a separate, but related chart, note that Intel surged on Tuesday and has held above the 200-day SMA for seven days (closing basis). The chart shows Intel with higher closing highs in early November, early December and now early February. Combined with a higher low from October to December, it looks like an uptrend for Intel over the last few months.
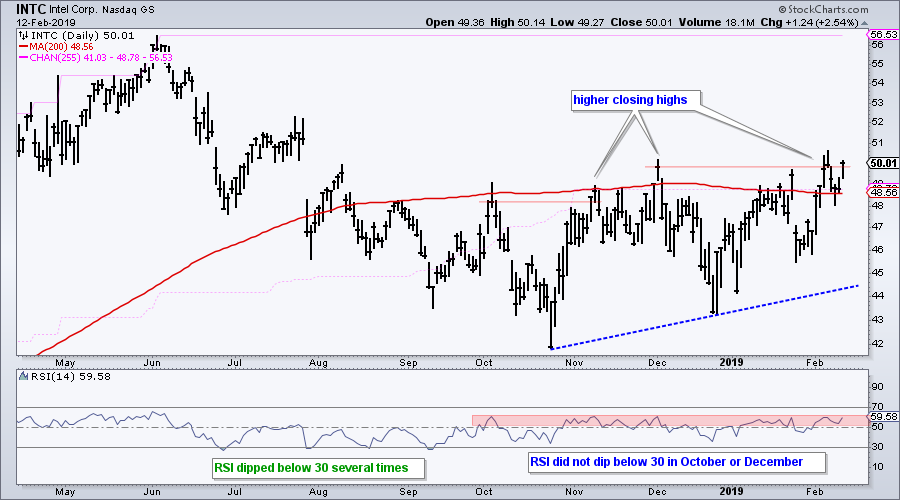
The indicator window shows RSI dipping below 30 several times from late June to September. The stock market fell apart in October, but RSI did not dip below 30. The stock swooned again in December, but RSI held above its October low. This shows less downside momentum on the dips and this is the first step to a consistent uptrend (higher lows). A momentum breakout is the second. RSI is currently having trouble breaking above 60 though and remains in the bear range. Look for a breakout here to shift RSI into the bull range (40-80).
On Trend on YouTube
Uptrends that Won't Back Down
- QQQ and SPY Hold as IWM Outperforms
- XBI Outperforms IBB (plus ITB, XRT, KRE)
- Focus on Payments Industry (SQ, V, MA...)
- Weakness in Media Land (CBS, NWSA, DIS...)
- Combining Daily and Weekly Analysis (FFIV)
- Stock Setups: ISRG, FORM, FNSR, IONS, VCEL
- Click here to Watch
- Arthur Hill, CMT
Senior Technical Analyst, StockCharts.com
Book: Define the Trend and Trade the Trend
Twitter: Follow @ArthurHill


