... The stock market took a rest last week as the S&P 500 stalled in the 2708 area, which is just below the 200-day SMA. Note that the S&P 500 rose 24 of the last 31 days and gained around 15% in six weeks. It still looks like a precarious place for the index, but the short-term trends are up as SPY and QQQ hold their breakout zones.
The first chart shows SPY breaking out of a pennant formation on January 30th and falling back over the last two days. The breakout zone in the 265-266 area is still holding and this means the pennant is the pattern in play. Look for a break below 265 and an RSI break below 50 to signal a possible trend reversal.
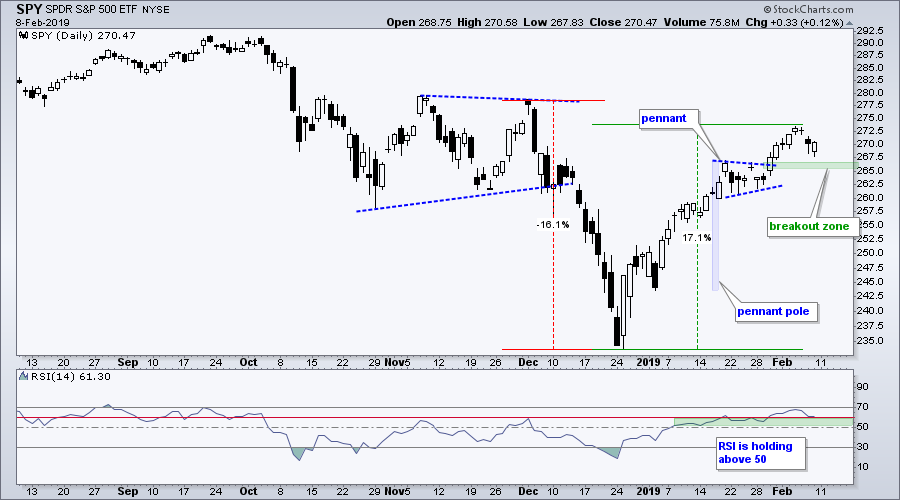
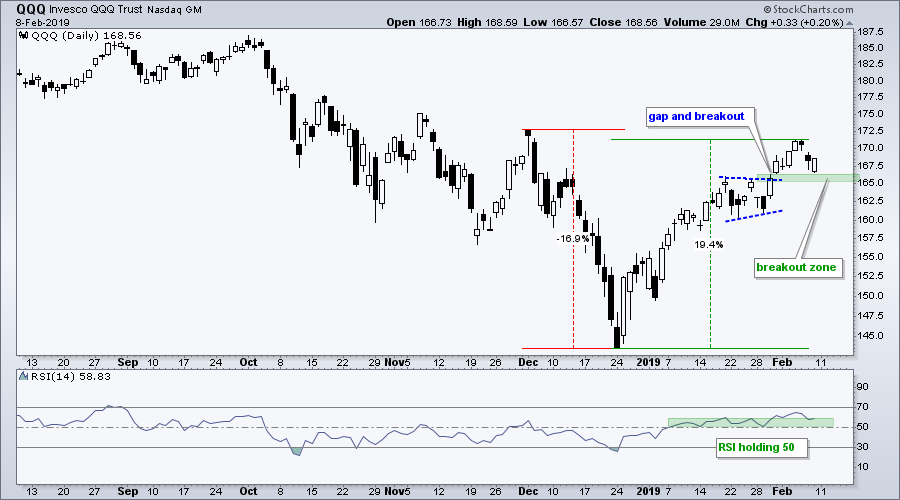
The second chart shows QQQ with a breakout zone around 165-166. I consider this breakout bullish as long as QQQ holds 165 and RSI holds above 50. Notice that RSI has been above 50 since January 7th for QQQ and SPY.
Stocks with Bullish Consolidations
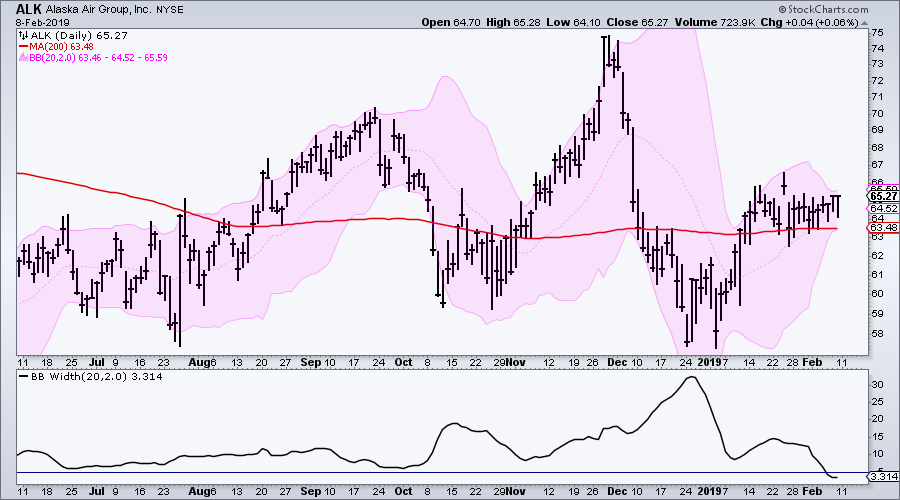
The next charts feature stocks that are consolidating above their 200-day SMAs. While I do not view the 200-day SMA as a support or resistance level per se, it does provide an idea for the general direction of the trend. In addition, keep in mind that the S&P 500 is below the 200-day SMA. Thus, stocks and ETFs above their 200-day SMAs show relative "chart" strength.
The first chart shows Alaska Air (ALK) surging above its 200-day in mid January and then consolidating. Notice that the Bollinger Bands are narrowing and BandWidth below is below 5%, which means the squeeze is in play. Look for a break above the upper band to signal a continuation higher.
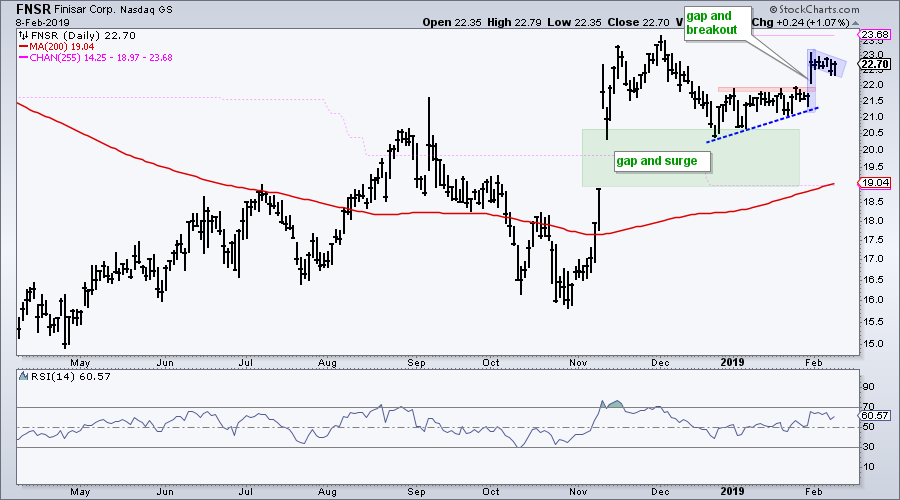
The next chart shows Finisar (FNSR) with a gap and breakout in late January. The stock stalled the last six days with a falling flag and a breakout at 23 would open the door to a new high. Note that the pink line at 23.68 marks the 255-day high, which is essentially a 52-week high.
On Trend on YouTube
The Moment and the Squeeze
- The Moment of Truth Arrives
- XLF Stalls Out (Plus JPM, BAC, WFC, GS, MS)
- Careful with ITB (Plus DHI, HD, LEN, PHM)
- Chart and Scan the Bollinger Band Squeeze
- 5 Squeeze stocks: ALK, BIIB, DIS, LYV, WBA
- Click here to Watch
To Chase or Not to Chase
- Reviewing the Turn of the Month
- Two Parts to an Uptrend
- HACK and SKYY Lead Tech ETFs
- Six Healthcare Leaders
- Four Teetering Tech Titans
- Stocks to Watch
- Click here to Watch
- Arthur Hill, CMT
Senior Technical Analyst, StockCharts.com
Book: Define the Trend and Trade the Trend
Twitter: Follow @ArthurHill


