- Reviewing the Weight of the Evidence
- New Highs Expand in XLK
- Sector Table is Net Bullish (XLK, XLV, XLI Lead)
- What If December-January Never Happened?
- Four Consolidations to Watch (XLF, IAI, XRT, IBB)
- New Additions to the ChartList
- AMD Keeps Flag Alive
- Finisar Holds Breakout
- Intuitive Surgical Breaks Pennant
- Walgreens-Boots Challenges Bollinger Band
- Eli Lilly and Microsoft Make the Cut
- ChartList Notes, Deletions and Additions
 ... S&P 500 Tilts Bullish
... Even though the broad market breadth indicators are net bearish, the indicators specific to the S&P 500 are net bullish. We will start by reviewing the broad market indicators and then turn to the sector indicators for the S&P 500.
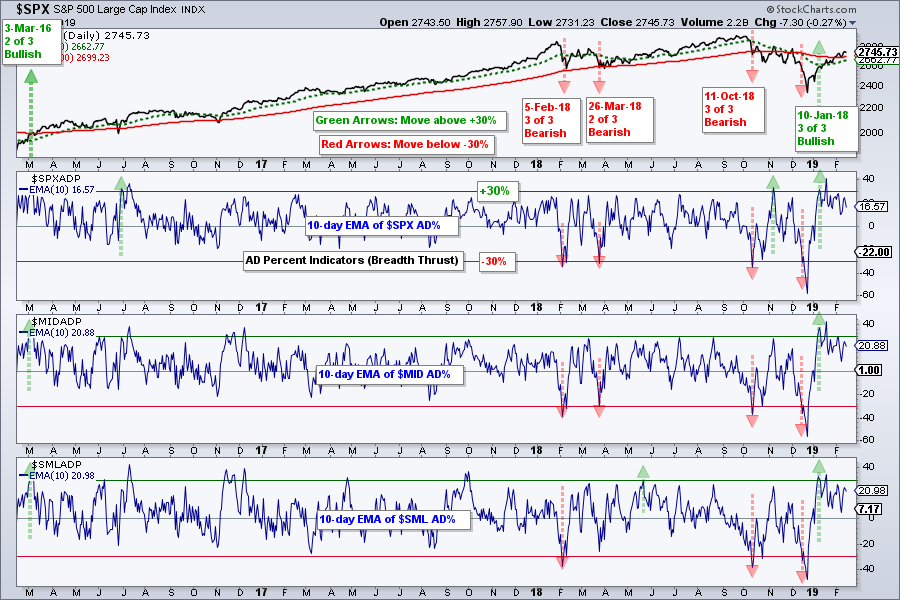
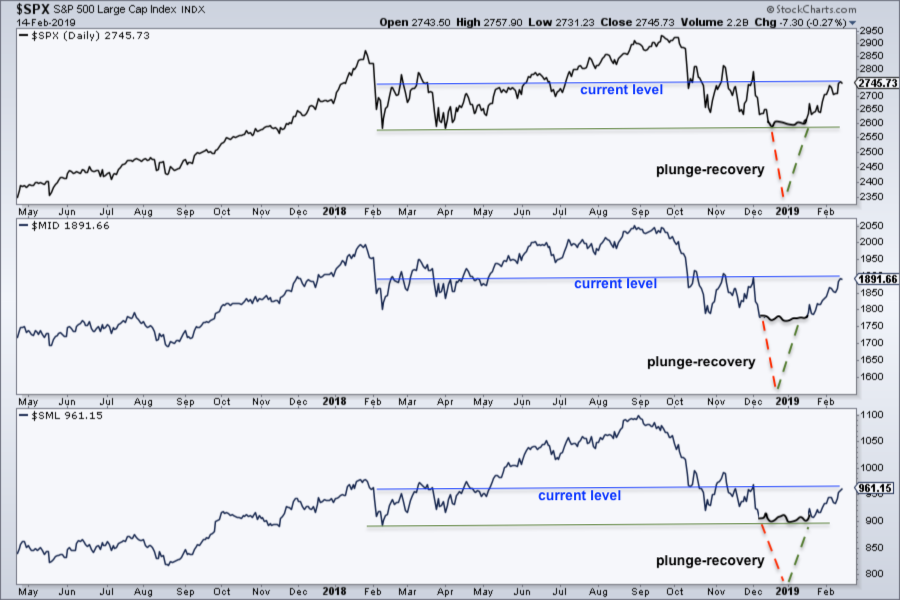
The first three charts show breadth indicators for the S&P 500, S&P Mid-Cap 400 and S&P Small-Cap 600. The first chart shows the 10-day EMA of AD Percent, which is used to measure breadth thrusts, both up and down. All three indicators surged above +30% for a bullish breadth thrust on January 10th. This was also around the time that the Zweig Breadth Thrust triggered. Also notice that the breadth indicators moved from the -50% area, which was deeply oversold. This was quite a move and a sudden change of heart.
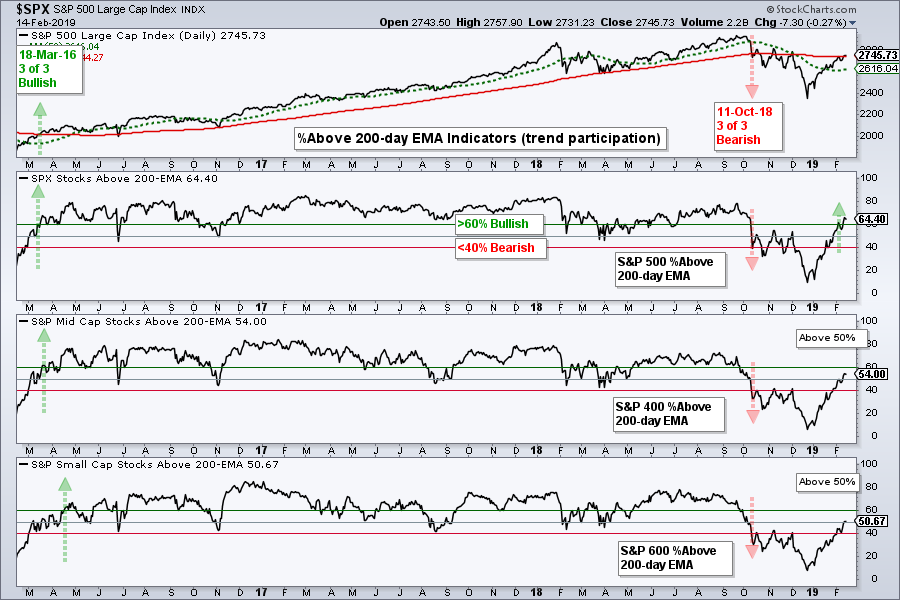
The next indicator is the percentage of stocks above the 200-day EMA, which measures long-term uptrends. Currently the S&P 500 is the only index with a bullish signal as this indicator exceeded 60% on February 5th. Around 54% of S&P Mid-Cap 400 stocks are above their 200-day EMA and 51% of S&P Small-Cap 600 stocks are above their 200-day EMA. The cup is getting half full for this indicator group. My bullish and bearish thresholds are above and below 50% to reduce whipsaws. Note, however, that this will not completely eliminate whipsaws (bad signals).
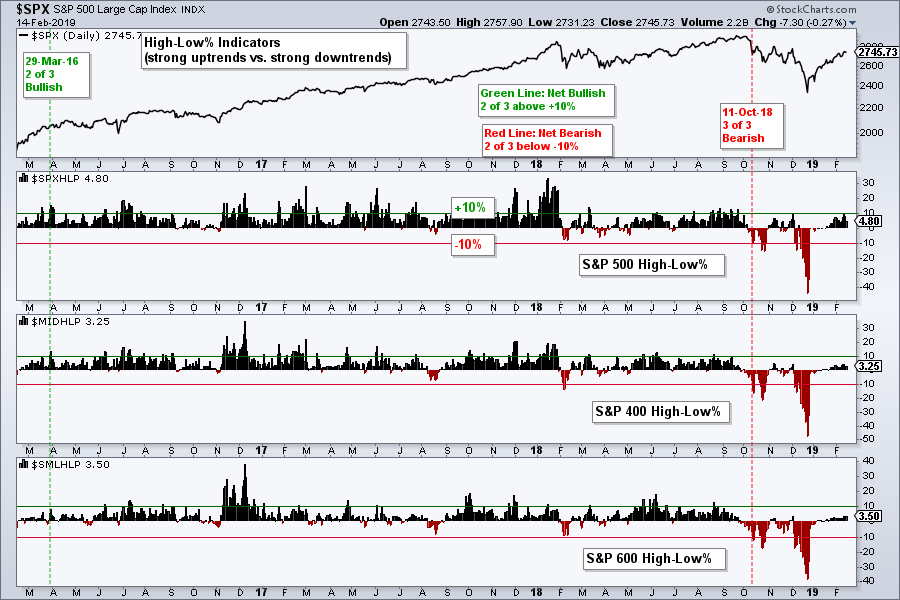
The next indicator is High-Low Percent, which measures the leaders and strong uptrends. A stock hitting a new high is clearly a leader and in a strong uptrend. S&P 500 High-Low% ($SPXHLP) reached +9.8% this week and fell just short of a bullish signal. S&P 400 High-Low% ($MIDHLP) and S&P 600 High-Low% ($SMLHLP) are still short of bullish signals and have yet to clear +5%. Thus, the bearish signals from October 11th have yet to be proven otherwise.
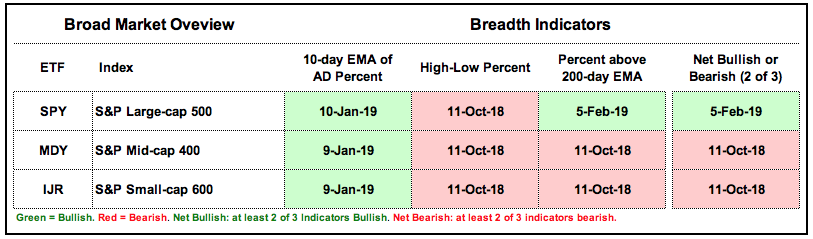
The table below comes from an Excel screenshot and sums up the indicator signals. The S&P 500 is net bullish because two of the three indicators have active bull signals, but the S&P Mid-Cap 400 and S&P Small-Cap 600 remain net bearish. Currently, five of the nine indicators are on bear signals and it would take just one flip to turn the group bullish again.
New Highs Expand in XLK
The next chart shows the Technology SPDR (XLK) with these same indicators. I also added Tech %Above 20-day EMA (!GT20XLK) and RSI(5) to identify short-term overbought or oversold conditions. The 10-day EMA of Technology AD% ($XLKADP) triggered bullish on January 10th, the Tech %Above 200-day EMA (!GT200XLK) moved above 60% on February 1st and XLK High-Low% ($XLKHLP) moved above +10% on February 12th. The indicators turned net bullish (2 of 3) on February 1st and all are currently bullish.
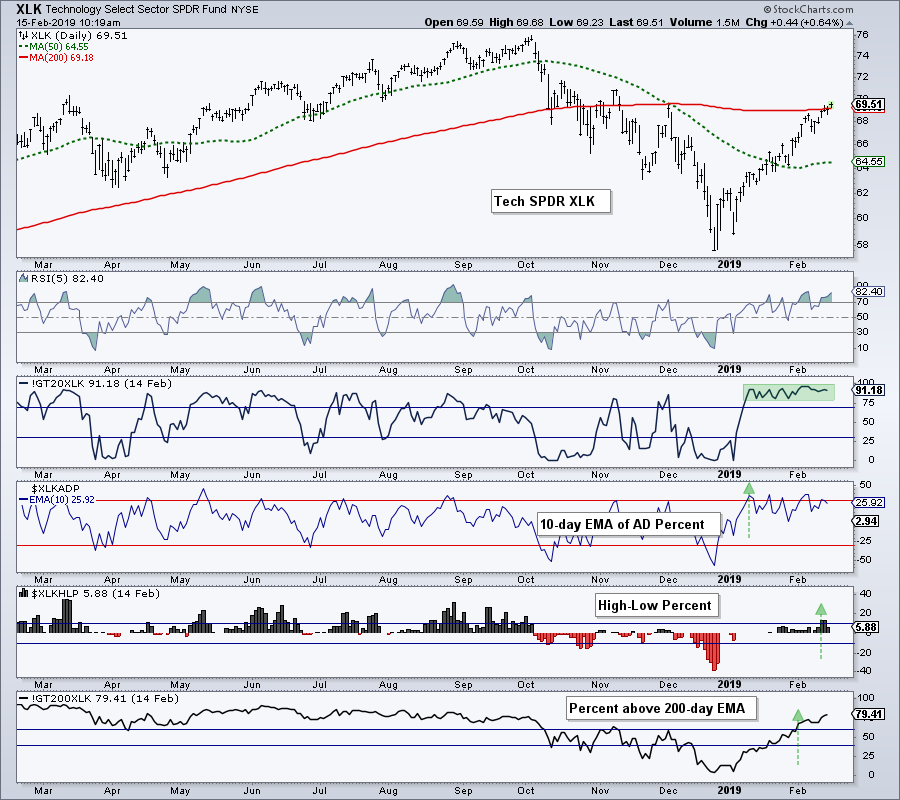
XLK is trading right at the 200-day SMA after a 20% advance in seven weeks. We do not need a momentum oscillator to understand that the ETF is quite extended and ripe for a rest. The percentage of stocks above the 20-day EMA has been above 70% since January 9th and this shows that the vast majority of stocks are still in short-term uptrends. Watch for a move below 70% to signal a possible pullback.
Chartists can plot these indicators for all eleven sectors. Simply change the sector letters in each symbol. For example, Tech High-Low% is $XLKHLP and Financials High-Low% is $XLFHLP. Similarly, there is Tech %Above 200-day EMA (!GT200XLK) and Finance %Above 200-day EMA (!GT200XLF). And, Technology AD% ($XLKADP) and XLF AD% ($XLFADP).
Sector Table is Net Bullish
The next table shows the indicator signals for the eleven sectors (11 sectors and 3 indicators equals 33 signals). Currently, there are 25 indicators on bullish signals and 8 on bearish signals. Only the Financials SPDR and Energy SPDR remain on bullish signals. The Utilities SPDR has been net bullish since June and the Health Care SPDR has been net bullish since January 10th.
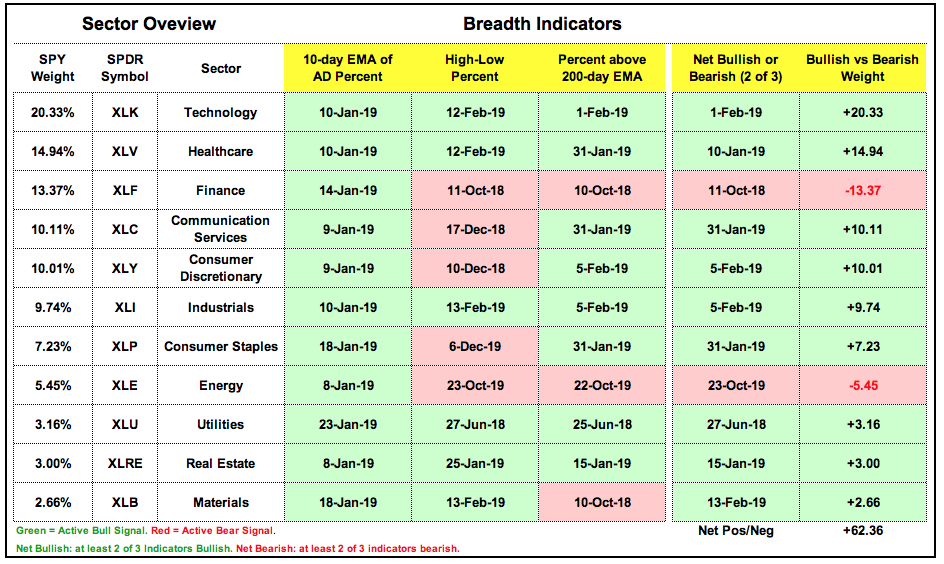
The sector weightings in the S&P 500 SPDR are shown on the left and the positive/negative weightings are tallied on the right. Five of the top six sectors are net bullish. All told, the bullish sectors total +81.18% and the bearish sectors total 18.82%. The net (bullish - bearish) is +62.36%. Keep in mind that this is just for the S&P 500 and does not include small-caps and mid-caps.
What If .....
What if the December plunge and January recovery never happened? I realize we cannot simply remove price action on a whim, but I think this exercise could help put things into perspective. Without this plunge-recovery, the February-April lows held pretty much in the S&P 500 and S&P Small-Cap 600 (green lines). It is hard to make the bear case without this plunge-recovery, but it is also hard to make the bull case. The S&P 500, S&P Mid-Cap 400 and S&P Small-Cap 600 are currently trading at the same levels as they were last February (blue lines). In short, these three indexes have gone nowhere in the past year. Of course, this long road to nowhere also includes 52-week highs in January and September as well as 52-week lows in December (plunge-recovery included).
Bottom Line: It is a stock picker's market. There are bullish undercurrents in the S&P 500 and several sectors, but the evidence is mixed when looking at small-caps and mid-caps as a whole. As always, it is usually best to stick with the leaders. Focus on stocks with strong uptrends and avoid stocks that are NOT in uptrends. This includes trading ranges, downtrends and stocks that “appear” to be reversing their downtrends.
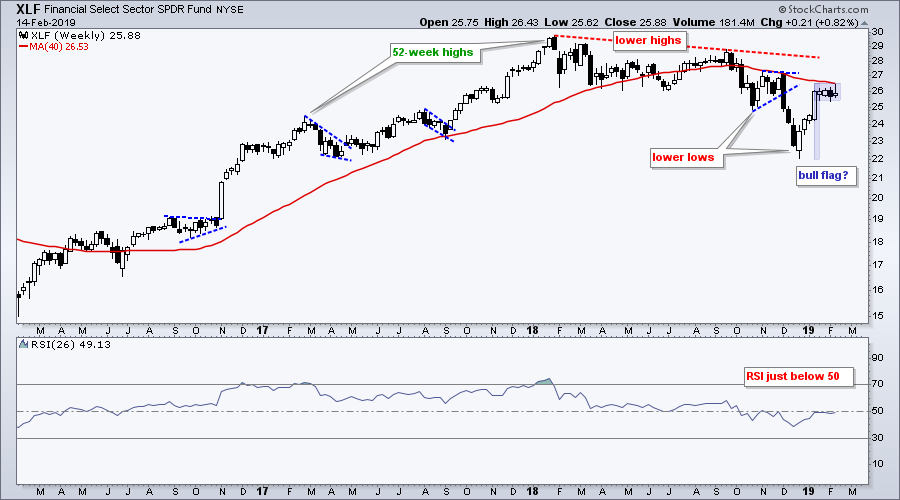
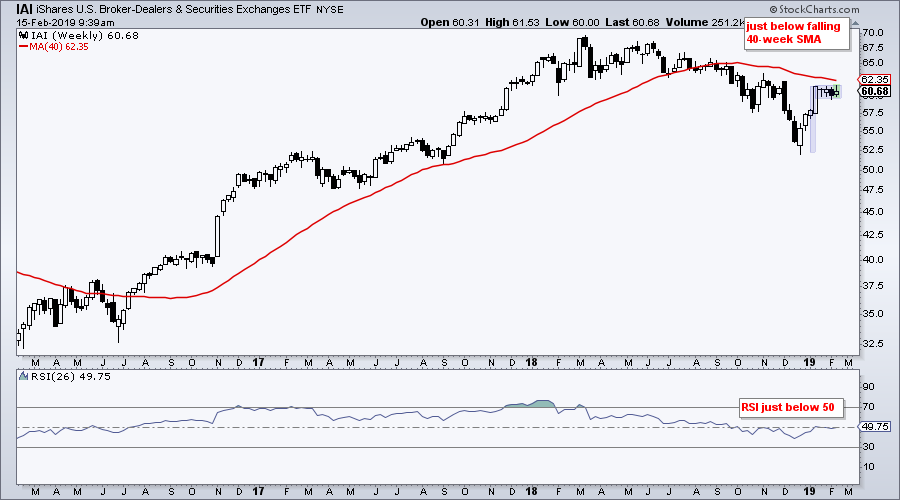
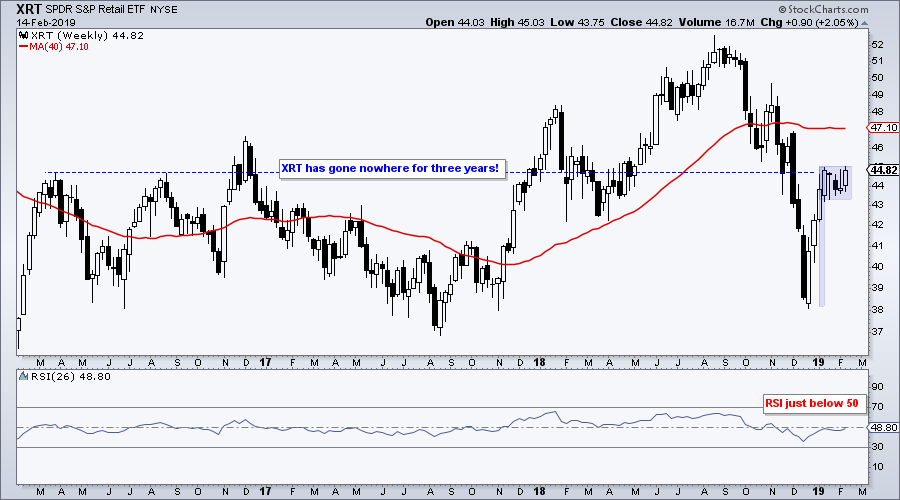
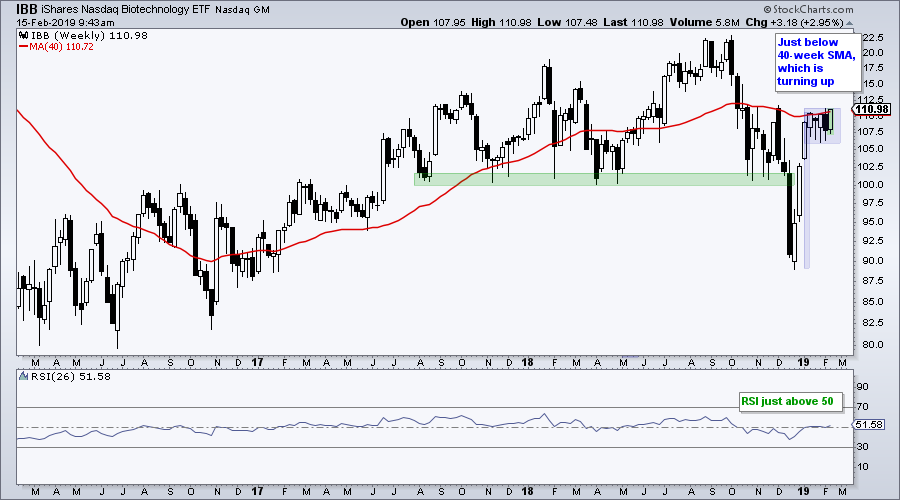
Four Consolidations to Watch (XLF, IAI, XRT, IBB)
The next charts show weekly candlesticks over the last three years with the 40-week SMA and 26-week RSI. RSI favors an uptrend when above 50 and an downtrend when below 50. RSI is very close to 50 for all four and all four formed consolidations over the last four weeks. These consolidations formed after sharp advances and could be flat flags. Upside breakouts would be quite positive and signal a continuation higher. Failure to break out to the upside and downside breaks would be negative. Support breaks would argue for a pullback (at best) or continuation of bigger downtrend (at worst).
Evolution of the ChartList
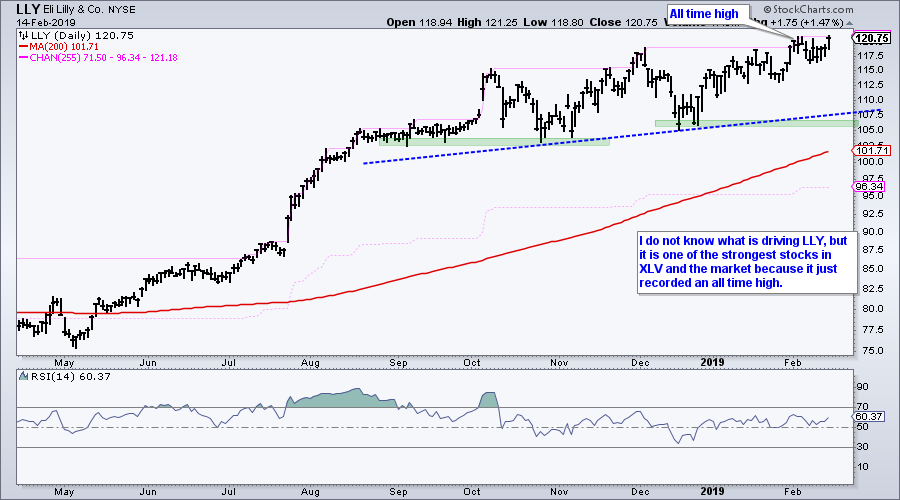
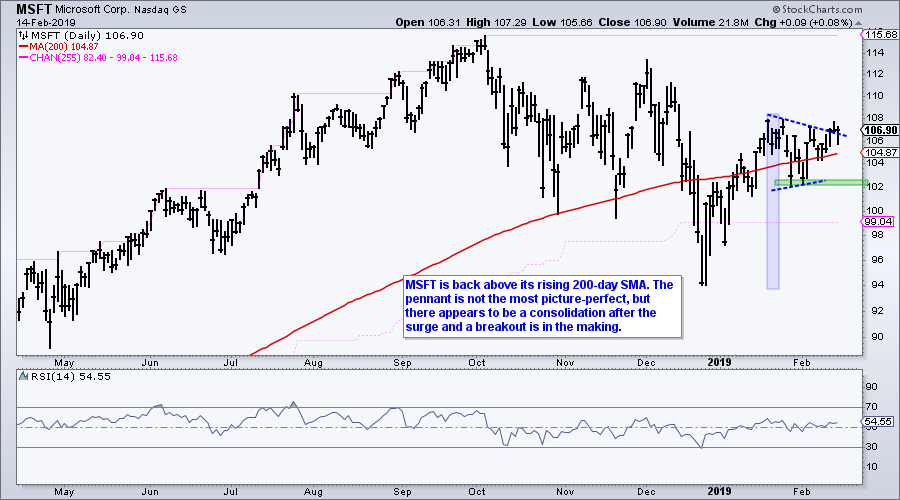
The Art's Charts ChartList is evolving into a list of stocks and ETFs with setups and trends that will be followed. These will be mostly bullish setups and uptrends. They will be updated at least weekly and stay on the list as long as the setup or trend remains in play. Today I am adding six stocks to the list: AMD, FNSR, ISRG, LLY, MSFT and WBA. All are above their 200-day SMAs and their 200-day SMAs are rising. Thus, they are in some sort of long-term uptrend.
What we don't know. Or, rather, what I don't know. I do not know which of these setups will fail and which will succeed. I do not know the upside potential, but I do have an idea of the downside risk. Sorry, upside targets are mostly guesswork. And finally, I cannot confidence-handicap these setups and suggest which ones have the best chances. Anecdotal evidence suggests high-confidence setups fail more often than low-confidence setups (Murphy’s law). You just never know.
AMD Keeps Flag Alive
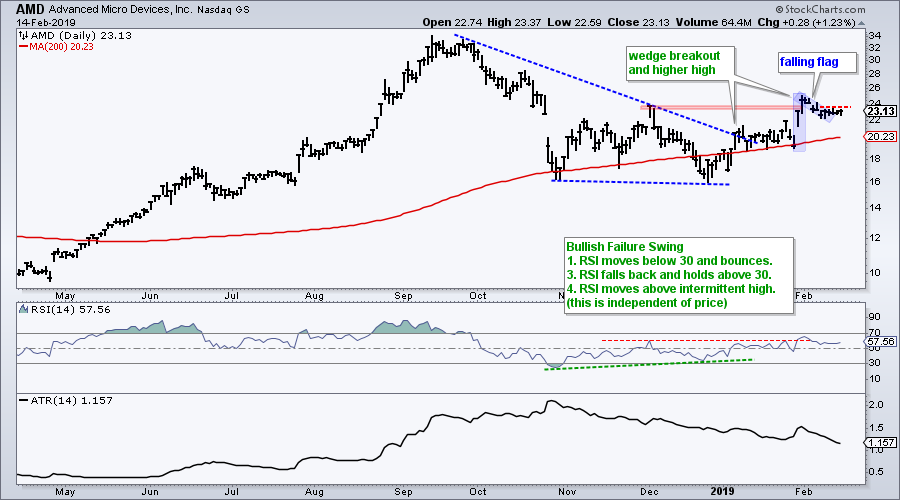
Advance Micro Devices (AMD) is a volatile stock with above average risk. For example, the 14-day ATR is 1.157 and this amounts to 5% of the closing price. For comparison, 14-day ATR for Merck (MRK) is 1.45 and this is just 1.8% of the closing price (78.94). MRK is clearly a less risky (volatile) stock than AMD. Higher risk means higher potential reward and higher potential loss. Position accordingly.
On the price chart, AMD broke out of a falling wedge and moved back above the rising 200-day SMA in January. The stock surged in late January and forged a higher high. A falling flag then took shape over the last few days and a breakout at 24 would be bullish. A close below the 200-day SMA would call for a re-evaluation.
Finisar Holds Breakout
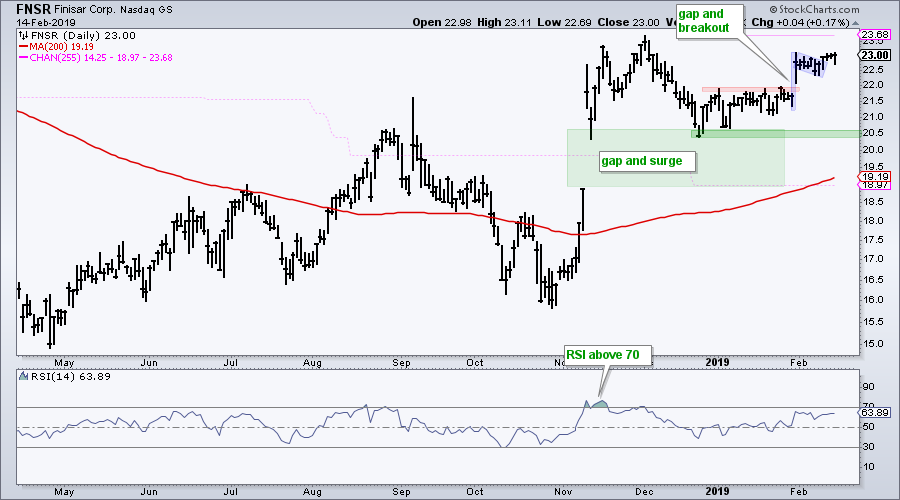
Finisar (FNSR) surged, gapped and surged again to a new high in November. The stock was way overbought in November and worked this condition off with a pullback. After firming at the top of the gap zone (green), the stock broke out again with a surge in late January. A falling flag then formed and the stock broke out of this pattern on Monday. A close below the November low would call for a re-evaluation.
Intuitive Surgical Breaks Pennant
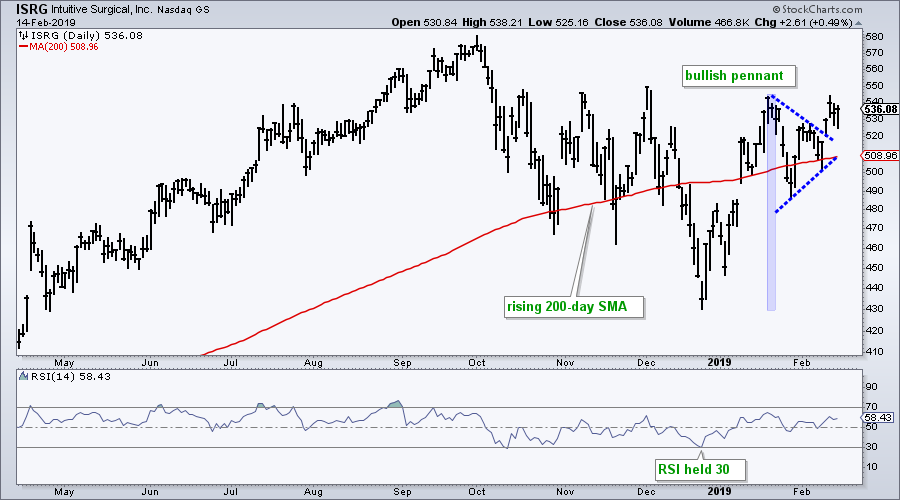
Intuitive Surgical (ISRG) is part of the healthcare sector and this is one of the stronger sectors right now. The stock plunged with the market in December, but RSI managed to hold 30 when most stocks were breaking below this level. ISRG surged in January, formed a small triangle or pennant and broke this pattern with a surge this week. A close below 500 would warrant a re-evaluation.
Walgreens-Boots Challenges Bollinger Band
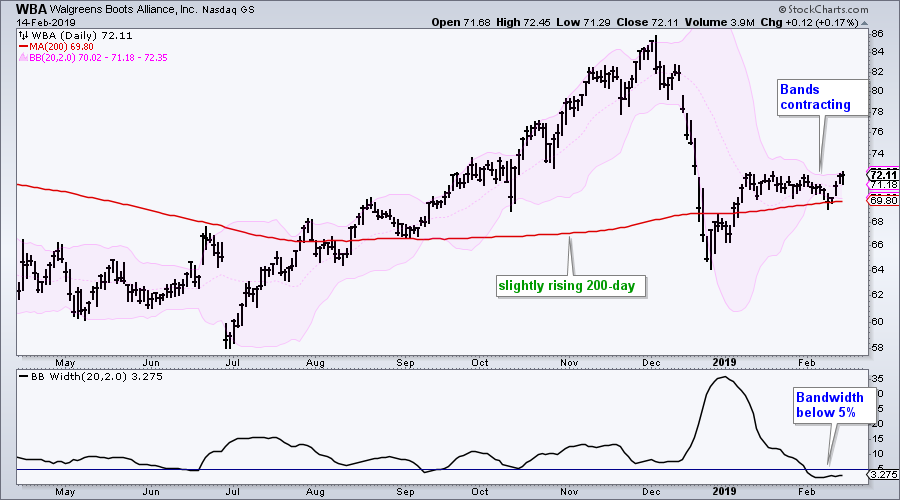
Walgreens-Boots Alliance (WBA) hit new highs in early December and then fell like a rock with the rest of the market. The stock managed to bounce near the 200-day SMA and then stalled as the Bollinger Bands contracted. Notice that BandWidth has been below 5% for two weeks. After a little head fake to the downside last week, the stock rebounded this week and is poised to break the upper band. Throw in a rising 200-day SMA and a little breakout could signal a continuation of the bigger uptrend. A close below the 200-day SMA would warrant a re-evaluation.
Microsoft and Eli Lilly Make the Cut
ChartList Notes and Deletions
On the Art's Charts ChartList, The Philippines iShares (EPHE), Indonesia iShares (EIDO), Russia ETF (RSX) and Poland ETF (EPOL) took hits this week. The breakout in RSX looks vulnerable and EPOL fell back before it had a chance to break out. I am removing these two from the ChartList. I am also removing the iShares S&P Nifty 50 ETF (INDY) because it has not moved in three months. EPHE and EIDO are pulling back after advancing and these are normal pullbacks at this stage.
For stocks, Cyber-Ark (CYBR) surged around 20% over the last five days, while Qualys (QLYS) fell around 11.5%. VMware (VMW) hit another new high with a 7.5% surge. There were also fresh new highs from Paypal (PYPL), Zscaler (ZS), Broadcom (AVGO) and Five9 (FIVN). Pulte Home (PHM) remains on the list, but the stock is starting to lag and is testing support. Watch closely.
Questions, Comments or Feedback?
I do not take symbol request and I cannot promise to response to all correspondence, but I will read it and take into under consideration. I greatly appreciate all feedback because it helps me improve the commentary and provides ideas for the future.

Plan Your Trade and Trade Your Plan.
- Arthur Hill, CMT
Senior Technical Analyst, StockCharts.com
Book: Define the Trend and Trade the Trend
Twitter: Follow @ArthurHill


