Chartists can compare two price plots to find early signs of relative strength. This can be done by comparing the corresponding peaks or troughs for two names, such as the Russell 2000 iShares (IWM) and the S&P 500 SPDR (SPY). It is a sign of relative strength when one holds a prior lows as the other breaks below corresponding lows. Such early signs of relative strength can foreshadow future outperformance.
IWM showed early signs of relative strength and then outperformed SPY this past week. Note that IWM surged 4.25% this past week and SPY was up 2.55%. As detailed in the charts below, IWM showed signs of relative strength in early January and early February by holding prior lows when the SPY broke these corresponding lows. This technique was featured in On Trend this past Tuesday.
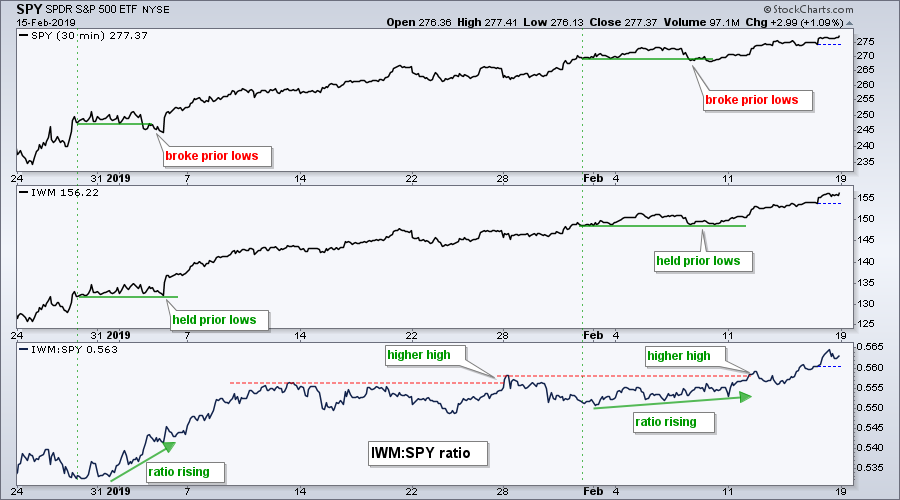
The indicator window confirms relative strength in IWM using the price relative (IWM:SPY ratio). First, notice the steep rise in the ratio in early January. Second notice that higher high in late January. Third, notice the slight rise in early February. And finally, notice the higher high on February 11th and a new high for the year this week. IWM is clearly outperforming SPY.
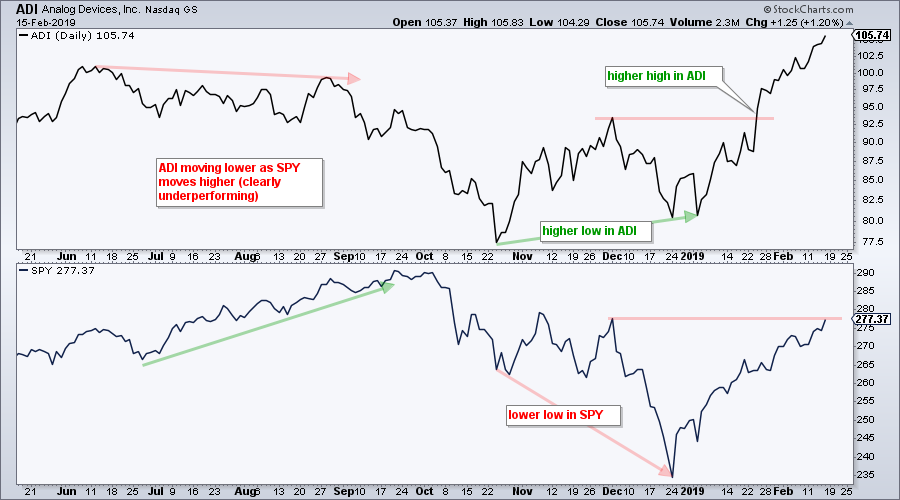
The next chart shows Analog Devices (ADI) in the top window and SPY in the lower window. ADI moved lower from June to September and seriously underperformed SPY, which was recording higher highs at the time. The dynamics started changing in December as ADI held above its October low and SPY recorded a lower low. ADI became a clear leader in late January as it broke above its early December high. SPY was well below this corresponding high at the time. ADI is currently trading at 52-week highs and still leading as SPY challenges its early December high.
On Trend on Tuesdays and Thursdays
China Goes for a Breakout (Thursday)
- Keys to the Short-term Uptrends
- Ranking Sector Breadth Indicators
- Double Bottoms in China (plus YUM)
- Autos are a Sickly Group (plus TSLA)
- Only 1 FAANG Above 200-day
- Stock Setups: CAT, GLW, ROST, TJX
- Click here to Watch
Stocks Won't Back Down (Tuesday)
- QQQ and SPY Hold as IWM Outperforms
- XBI Outperforms IBB (plus ITB, XRT, KRE)
- Focus on Payments Industry (SQ, V, MA...)
- Weakness in Media Land (CBS, NWSA, DIS...)
- Combining Daily and Weekly Analysis (FFIV)
- Stock Setups: ISRG, FORM, FNSR, IONS, VCEL
- Click here to Watch
- Arthur Hill, CMT
Senior Technical Analyst, StockCharts.com
Book: Define the Trend and Trade the Trend
Twitter: Follow @ArthurHill


