There are often smaller patterns within larger patterns and traders can get a jump on a bigger breakout by acting on the smaller pattern first. For example, a cup-with-handle is a bullish continuation pattern that typically forms over a few months. A falling flag is also a bullish continuation pattern, but it typically forms over a few weeks (short-term). I picked these two patterns for a reason because a bullish flag often forms as part of the handle in the cup-with-handle. And, it just so happens that we have a live example.
The chart below highlights InterActiveCorp (IAC) with some classic technical analysis and a pattern within a pattern. First and foremost, the bigger trend is up because the stock hit a 52-week high in February and is well above the rising 200-day SMA.
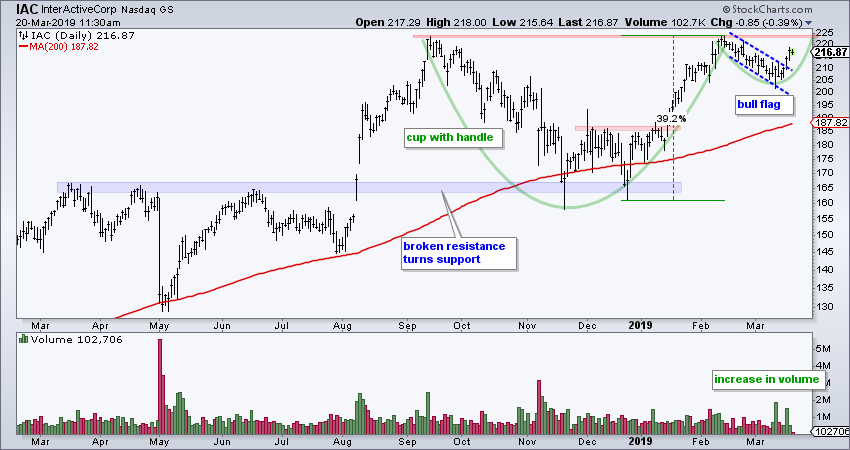
A large cup-with-handle is taking shape from September to March. This is a bullish continuation pattern that forms within an uptrend. The cup highs mark resistance in the 225 area and the handle is currently under construction. A break above rim resistance would confirm the pattern and argue for a continuation of the bigger uptrend.
Focusing 2019 price action, we can see a sharp advance and then a falling flag, which is a bullish continuation pattern. IAC was quite extended after a 39% move and ripe for a rest. The falling flag provided this rest and the stock broke out with a high volume surge the last few days.
This is the short-term breakout that could lead to a bigger cup-with-handle breakout at 225. I will add IAC to the Art's Charts ChartList with a re-evaluation on a close below 205.
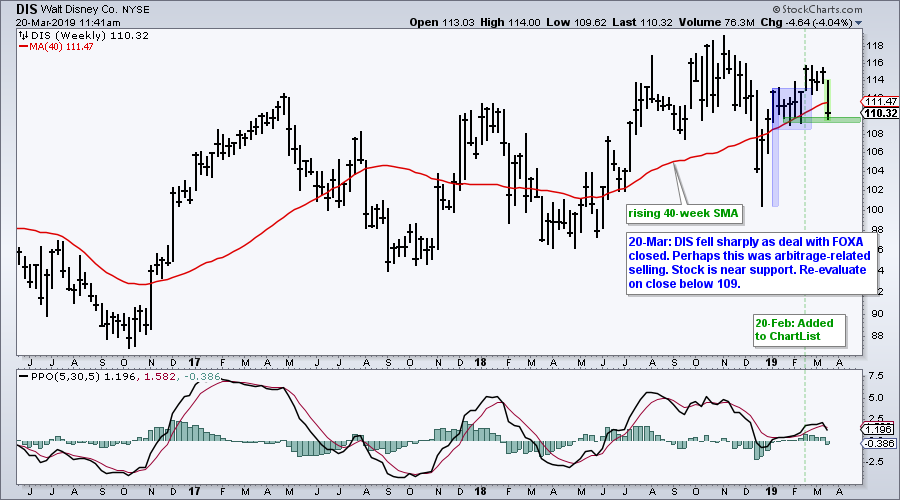
DIS Falls as Deal Closes
In ChartList news, Disney (DIS) fell rather sharply on Monday-Tuesday. I am not sure of the exact reason, but I suspect it had something to do with the closing of the Twenty-First Century Fox (FOXA) deal (arbitrage-related selling). The stock is near support and I will give it a few days to settle. Re-evaluate on close below 109. Here is the Art's Charts ChartList.
Semis Consolidate as Banks Break Out
- A Mixed Up March (SPY vs IWM)
- SOXX Hits High of the Year
- Semiconductor Stocks to Watch
- Finance SPDR Comes to Life (XLF)
- Banking Stocks with Breakouts
- Amazon Breaks 200-day
- Click here to Watch
Questions, Comments or Feedback?
I do not take symbol request and I cannot promise to response to all correspondence, but I will read it and take into under consideration. I greatly appreciate all feedback because it helps me improve the commentary and provides ideas for the future.

- Arthur Hill, CMT
Senior Technical Analyst, StockCharts.com
Book: Define the Trend and Trade the Trend
Twitter: Follow @ArthurHill


