- 20-day Holds above 200-day for S&P 500
- Weekly RSI Holds above 50.
- Large-caps Lead Index Breadth.
- Tech, Utilities and REITs Lead Sector Breadth.
- The Dreaded Shakeout (VRTX).
- Consider Position Sizing (SCWX).
- Consider Profit Targets (PYPL).
- ChartList Updates.
 ... 20-day Holds above 200-day
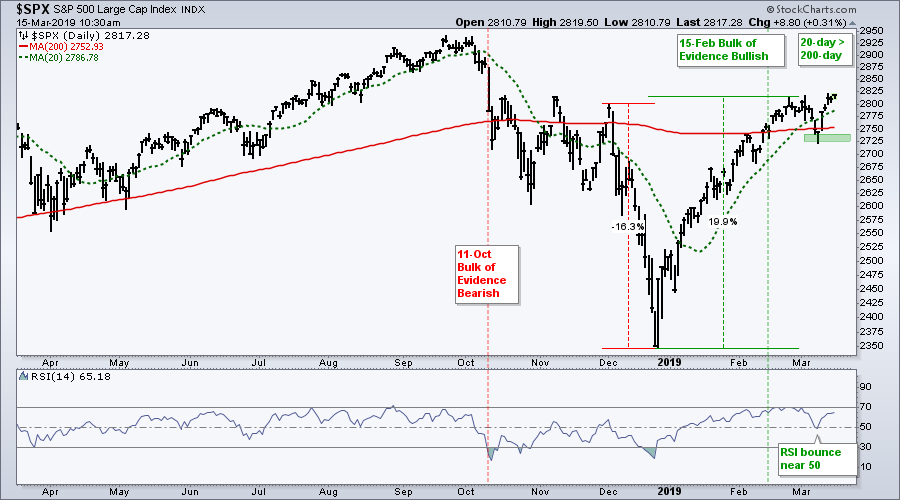
... The S&P 500 sneezed last week and broke below its 200-day SMA, but rebounded this week and edged above its early March high. Yep, the S&P 500 hit a new high for 2019 this week and the bulk of the evidence remains bullish. As noted last week, I am watching the 20-day SMA for the first signs of a meaningful downturn. The index also established short-term support in the 2700-2750 area with last week's low. Thus, the bulls are clearly in control as long as the 20-day holds above the 200-day and the index holds 2700 on a closing basis.
Weekly RSI Holds above 50
On the weekly chart, the S&P 500 fell below the 40-week SMA last week and this prompted me to draw the third red arc on the chart. Sure enough, the market gods saw this annotation and decided to make it questionable with a 2+ percent surge this week. Even with this bounce and the 20% surge since late December, the index has gone everywhere and nowhere the last 59 weeks. The index has yet to exceed its January 2018 high and remains well below its September high.
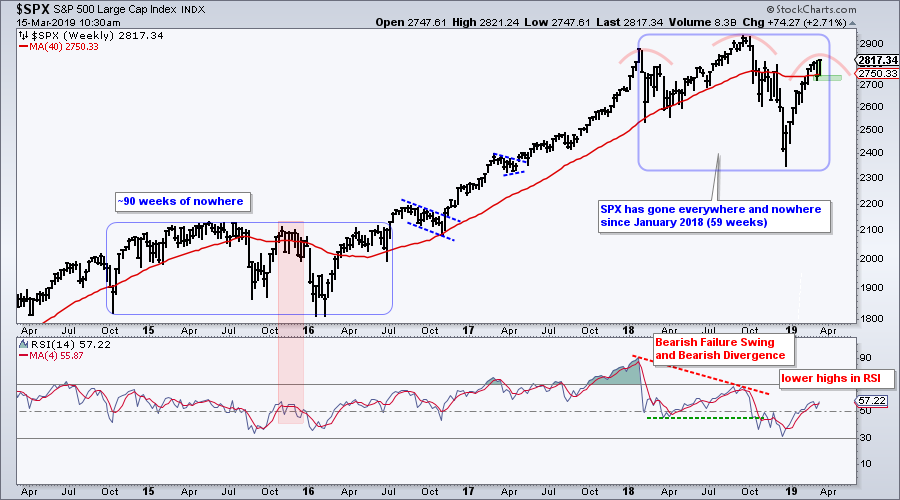
Despite a choppy road to nowhere, the bulk of the evidence is currently bullish and I am watching weekly RSI closely. The indicator window shows 14-week RSI moving above 50 in late January and holding above 50. The trend-momentum cup remains half full as long as RSI remains above 50. A weekly close below 50 would be negative and argue for a reassessment.
S&P 500 Leads Index Breadth
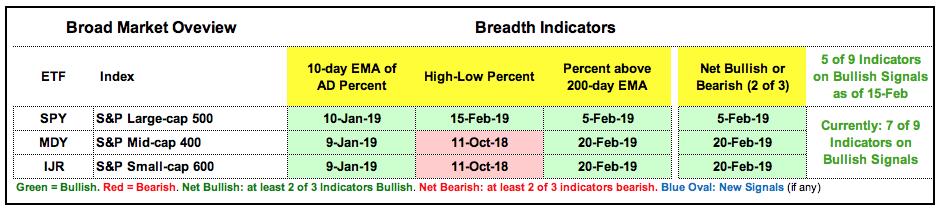
The index breadth table remains bullish, but the High-Low Percent indicators for the S&P Small-Cap 600 and S&P Mid-Cap 400 have yet to trigger. Five of the nine indicators have been on bullish signals since February 15th and seven of the nine are currently on bullish signals. It is worth noting that S&P 500 High-Low% ($SPXHLP) reached +13% on Wednesday and continues to produce new highs. 64% of S&P 500 stocks and 52% of S&P Mid-Cap 400 stocks are above their 200-day EMAs. This number drops to 44% for the S&P Small-Cap 600. It is not the strongest market as a whole, but the weight of the evidence is bullish until proven otherwise. And not a moment sooner.
Tech, Utilities and REITs Lead Sector Breadth
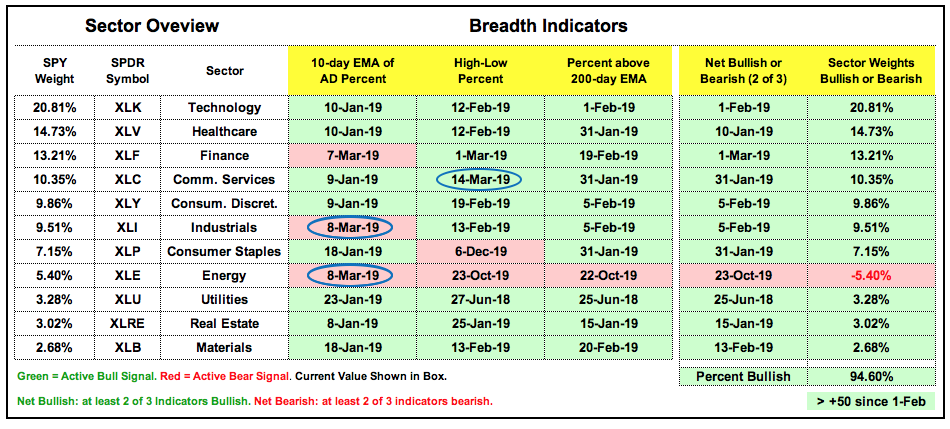
The sector table remains net bullish with 27 active bullish signals and 6 active bearish signals (11 sectors and 3 signals per sector). Technology, utilities and REITs are the strongest sectors right now and they produced the most new highs this week. Finance, industrials and consumer staples only have two bullish signals working and are the least strong. Energy is by far the weakest with all three indicators on bearish signals.
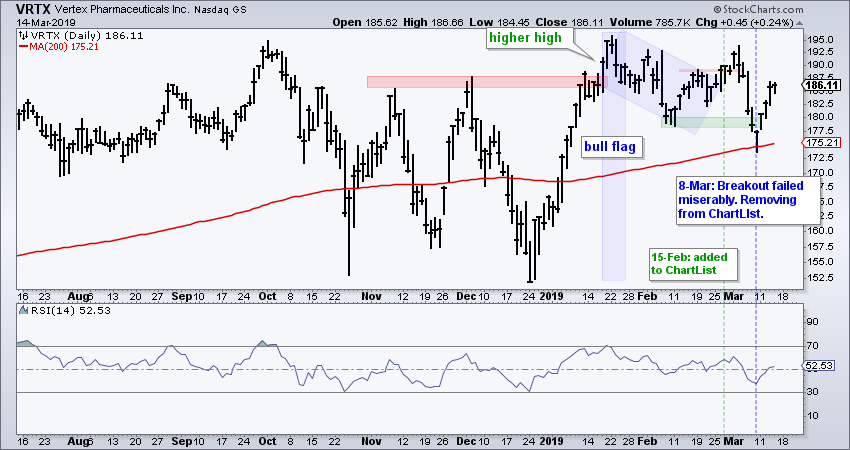
The Dreaded Shakeout
The next sections focus on some recent additions/deletions from the Art's Charts ChartList to see what we can learn. Vertex (VRTX) was added to the ChartList on 15-February with a breakout, but fell below the flag low as the breakout failed. The stock was removed from the ChartList on March 8th and rebounded this week. Perhaps this was a just shakeout from the resignation of the FDA commissioner and weakness in the broader market. Regardless of the reason, the flag breakout clearly failed and this is why it was removed from the ChartList.
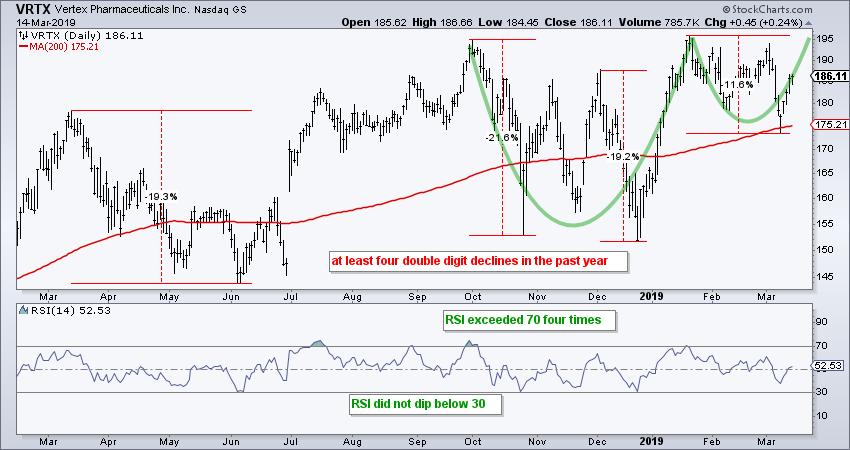
The longer-term chart still holds promise with the 200-day SMA marking the first re-evaluation level. The next chart shows VRTX with four double digit declines over the past year. The most recent decline was around 11.6% from high to low and the stock held the rising 200-day SMA. This is clearly a volatile stock with some pretty big swings, but I will see a constructive chart. The stock has higher highs and higher lows for an overall uptrend the last 12 months. RSI did not exceed 30 on the dips and moved above 70 four times. This suggest more strength in upside momentum than downside momentum. And finally, the bigger pattern looks like a bullish cup-with-handle. This would not be confirmed until there is a break above 195 though.
I don't focus on the fundamentals in detail, but I do like to be aware of the big trends in industry groups and select stocks. For example, the electronic payments space is a secular growth story for stocks like Visa (V), Paypal (PYPL), Mastercard (MA) and Square (SQ). Vertex Pharmaceuticals recently caught my attention for a possible revenue explosion based on a drug approval next year (from $2 billion to $7 billion). You can hear the details from Michael Yee of Jefferies as he discusses the next biotech breakout targets. CNBC video (here). Yee starts at 1:30 mark and Vertex comments at 3:40 mark.
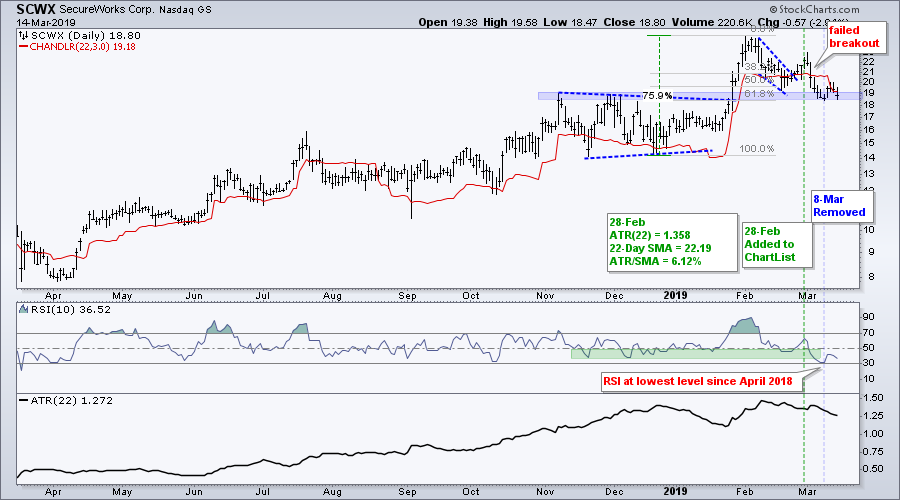
Consider Position Sizing
Secure Networks (SCWX) was added to the ChartList on 28-Feb with a wedge breakout and surge off broken resistance. This breakout failed as the stock fell back below the wedge low the very next week. This stock shows that we should consider some form of position sizing for stocks with above average volatility (aka risk). Notice that SCWX was up 76% before the pullback and the falling wedge marked a 22% decline. These two moves occurred within two months and showed that this was one volatile stock. ATR(22) was 1.358 and the 22-day SMA was 22.19 on February 28th. Dividing ATR by price shows ATR as a percentage of price (6.1%) and we can compare this level for relative volatility.
I ran a scan of the S&P 500 and ranked the results by ATR%. Nektar Therapeutics (NKTR), General Electric (GE) and Advanced Micro Devices (AMD) had the highest values, but all three ATR% values were below 5% and well below that for Secure Networks. As far as position sizing is concerned, traders can consider it for all positions or for positions with above average volatility. Something as simple as a half position in stocks with above average volatility can reduce risk (and stress).
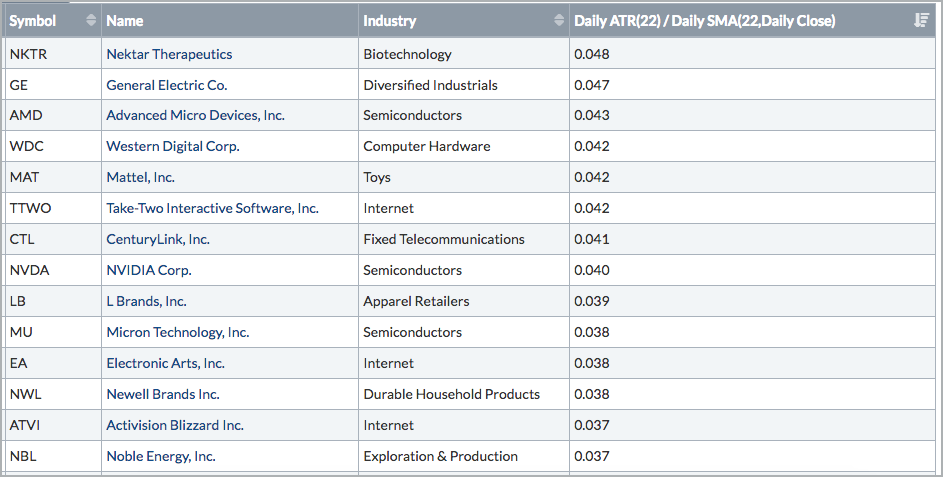
Scan Code:
[Group is SP500]
Rank by ATR(22)/SMA(22,Close)
Consider Profit Targets
Depending on your time horizon and tax considerations, I see nothing wrong with taking profits at certain points. As the old saying goes ... a bird in the hand is worth two in the bush. Most of my trading system testing shows better results when a profit target is added to the system. Namely, the drawdowns become less deep and the winning percent improves. Keep in mind that this is based on 1000s of trades over 10+ years. There will be exceptions to the rule!
The chart below shows Paypal (PYPL), which was added to the Art's Charts ChartList after the breakout in mid January (green line on 18-Jan). The gray lines show the Keltner Channel (1,3.0,22). This indicator sets a channel multiple ATR values above and below a moving average. In this case (1,3.0,22), I am setting channels that are three ATR(22) values above and below the 1-day moving average, which is just the close. The upper Keltner was at 99.24 on January 24th and this can be used to set an upside target.
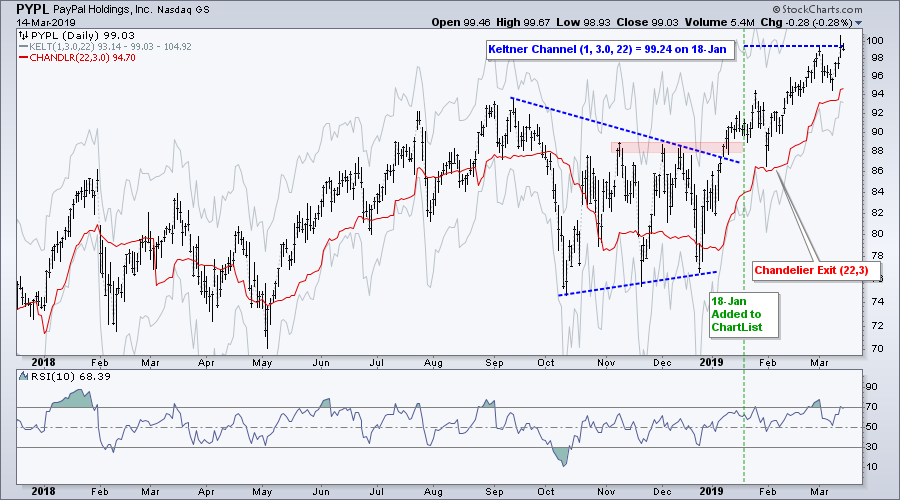
For trend followers, the red line shows the Chandelier Exit (22,3). This indicator is set three ATR(22) values below the 22-day high. Thus, it trails prices when they move higher and acts as a trailing stop. At current levels, PYPL would need to fall 5% to trigger the Chandelier Exit. With the stock up around 9% since 18-Jan, this would more than half the current gain.
ChartList Updates
The Art's Charts ChartList has been updated with comments and annoations. Losses in trading are like expenses when running a business. They are unavoidable and the business cannot survive if the losses are bigger than the revenues (winners). Some recent losers and current winners are shown below:
Recent Losers: SCWX -15%, VRTX -7%, WBA -10%, AMD -8%
Current Winners: PALL +15%, PYPL +8%, TWLO +24%, WDAY +8%, VRSN +10%, ED +8%
Chartists might consider profit targets or trailing stocks for some of the winners.
190308 Removed DATA, EXPE, PFE, VRTX, FOXF, AMD and SCWX
190308 Added IEF and TLT.
The Art's Charts ChartList focuses on stocks and ETFs with stable uptrends and strong momentum. I take a portfolio approach (20-30 positions) to spread risk and keep position sizes relatively small (3-5%). I do not know which picks will work and which will fail. There will be failures and successes as well as slumps and streaks. Hopefully, when measured on a monthly or quarterly basis, the successes will outpace the failures and the net will be positive.
Questions, Comments or Feedback?
I do not take symbol request and I cannot promise to response to all correspondence, but I will read it and take into under consideration. I greatly appreciate all feedback because it helps me improve the commentary and provides ideas for the future.

Plan Your Trade and Trade Your Plan.
- Arthur Hill, CMT
Senior Technical Analyst, StockCharts.com
Book: Define the Trend and Trade the Trend
Twitter: Follow @ArthurHill


