- Bigger Downtrends or Simply Resting?
- Bank ETFs Fail at 200-day SMAs.
- Small-cap Indexes Fail near Retracements.
- Oil Nears Potential Reversal Zone.
- Focus on the True Leaders.
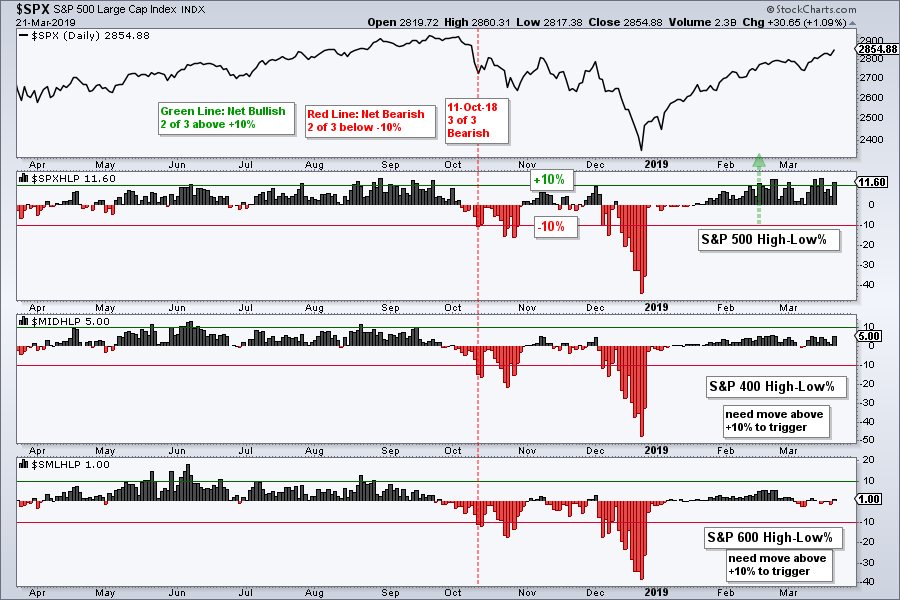
- S&P 500 Maintains Uptrend.
- Index Breadth Table Remains Bullish.
- Sector Breadth Table is More Mixed.
- Staples, Utilities, REITs and Tech.
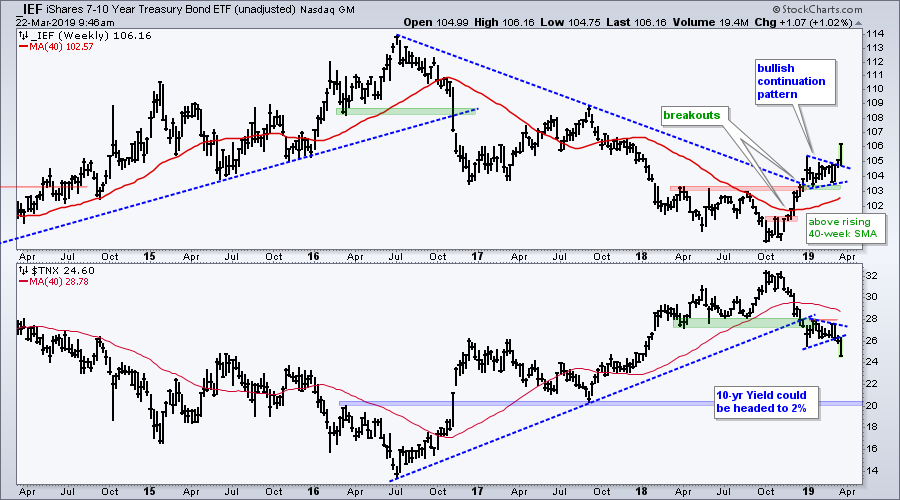
- Bonds Extend on Breakout.
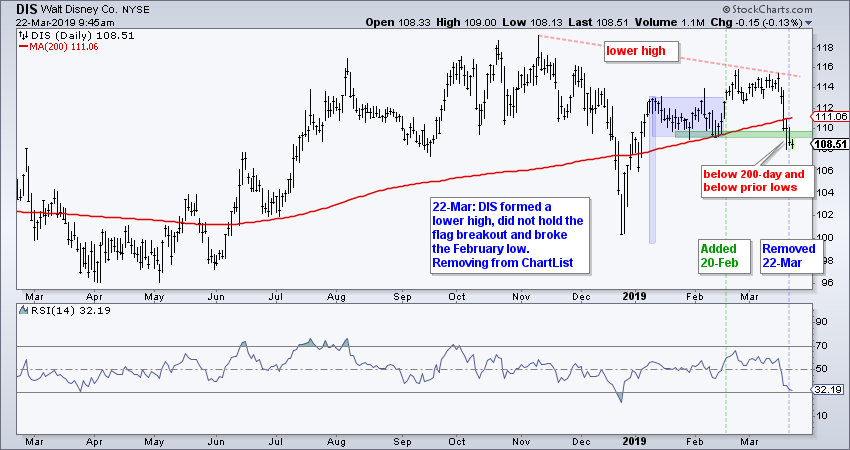
- Disney Removed from ChartList.
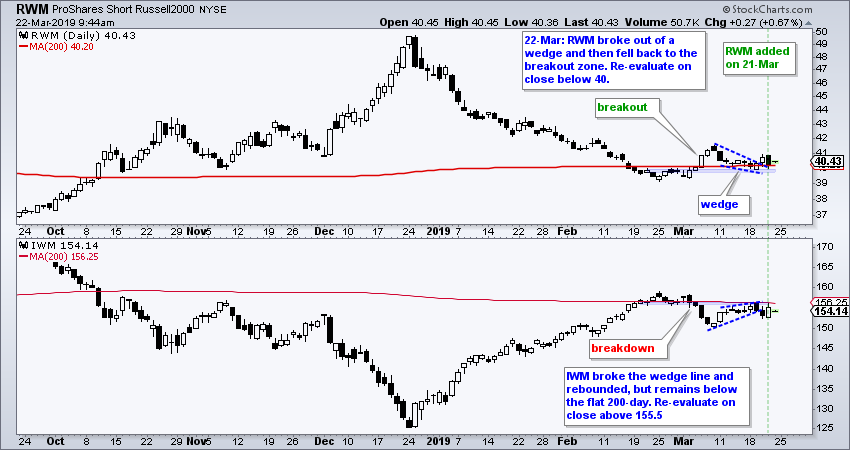
- Short Russell 2000 ETF Added.
 Bigger Downtrends OR Simply Resting?
While the bulk of the evidence remains bullish for the S&P 500, there are clearly some negative undercurrents within the broader market. I am just talking about stock-related undercurrents, such as breadth, key industry groups and certain styles.
Within the consumer discretionary sector, the Home Construction iShares (ITB) and the Retail SPDR (XRT) surged over 20% from their late December lows and then moved lower in March. Both peaked near their 61.8% retracement lines and are below their falling 200-day SMAs. Is this a big failure at the 200-day and key retracement? One could certainly argue that the long-term trends are down and these 20+ percent surges are just big counter-trend bounces. Think two steps down and one setup up.
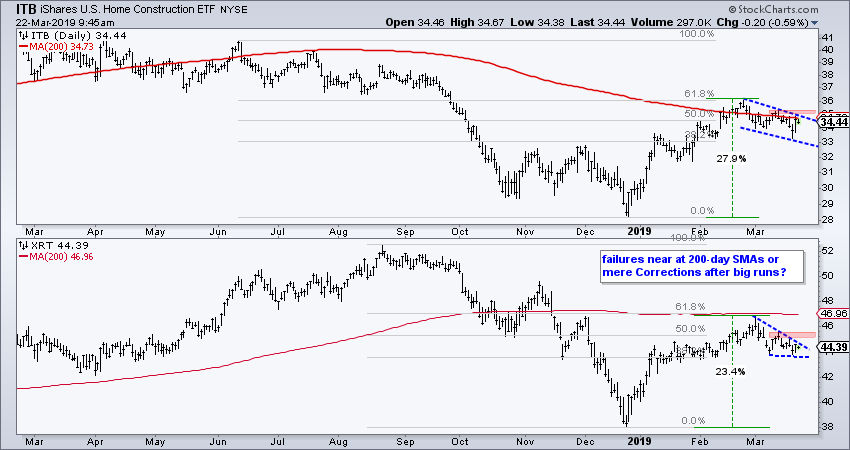
On the other side of the coin, the March declines could be just corrections after a big advance. ITB could be forming a bull flag with resistance near 35 and XRT could be forming a bullish wedge with resistance near 45. Breakouts are needed to confirm these "potentially" bullish patterns. Without breakouts, the failures near the 200-day SMAs and key retracements are the dominant chart features and they are bearish.
Bank ETFs Fail at 200-day SMAs
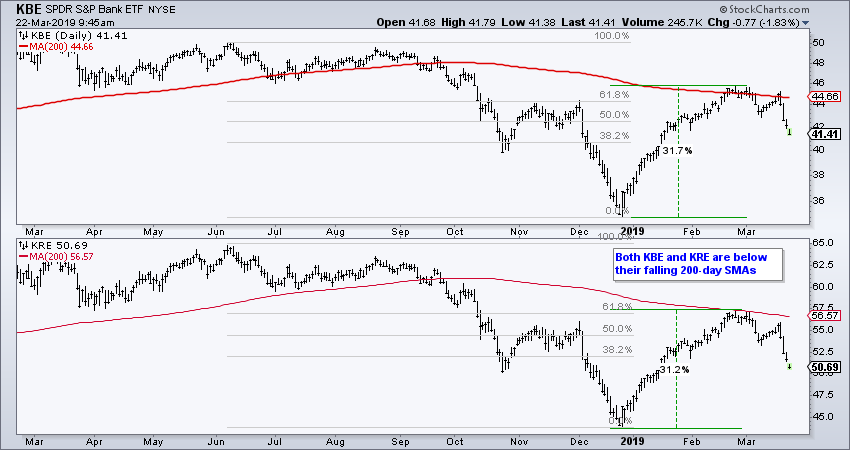
The next two charts show the Bank SPDR (KBE) and the Regional Bank SPDR (KRE) surging to their falling 200-day SMAs in late February and moving sharply lower in March. Both recorded 52-week lows in December and both are well below their summer highs, which were not even 52-week highs. There is a clear case to be made that both of these ETFs are in long-term downtrends. Moreover, it looks like these downtrends are continuing with the March declines.
Small-cap Indexes Fail near Key Retracements
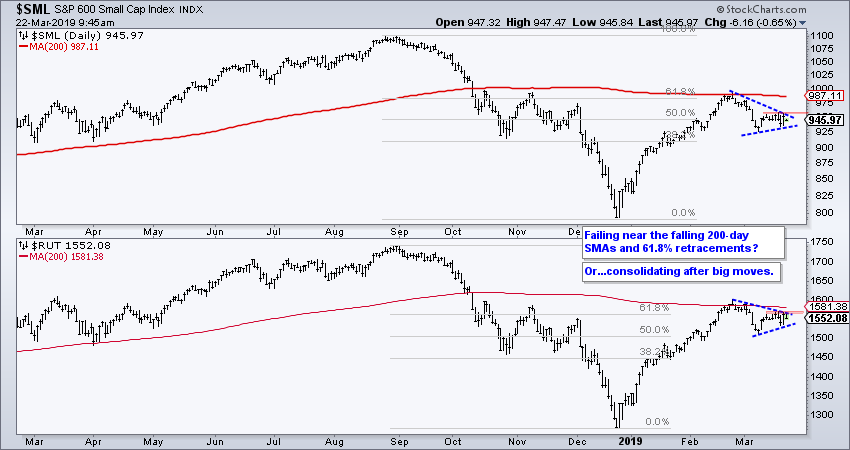
Taking a broader look, the S&P Small-Cap 600 and the Russell 2000 also reached potential reversal areas (61.8% retracements and falling 200-day SMAs). Both are down month-to-date and severely lagging large-caps ($SPX). I am not concerned with relative weakness when the advance is less, as long as it is an advance. I am, however, concerned with absolute weakness because an absolute decline in prices reflects selling pressure. Thus, the S&P 500 shows buying pressure in March, but the S&P Small-Cap 600 and Russell 2000 show selling pressure this month. Thursday's big advance was impressive and triangles could be forming. Let's see some follow through with triangle breakouts before taking this post-Fed bounce seriously. Right now, the failures near the 200-day SMAs and key retracements look dominant.
Oil Nears Potential Reversal Zone
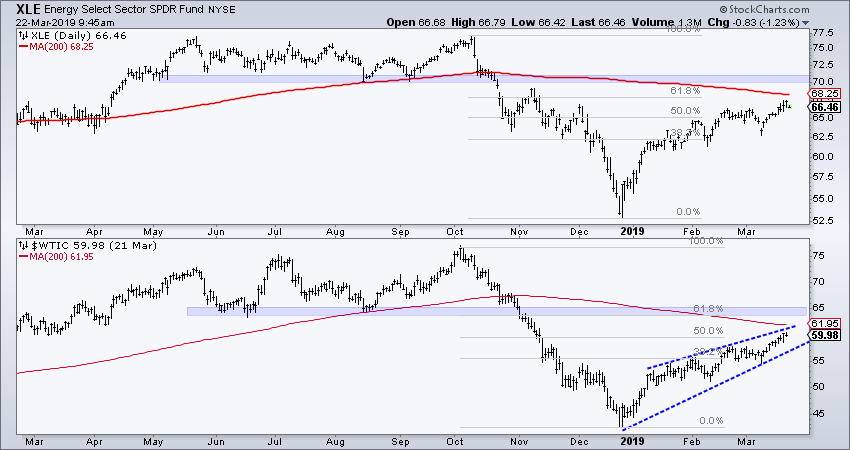
While I do not view the energy sector and oil as vitally important to the broader stock market, their charts are similar to the those above. The Energy SPDR (XLE) and Light Crude Continuous Contract ($WTIC) are both below their falling 200-day SMAs and well below their October highs. Sure, they had big moves since December 24th, but they are not the leaders right now. In fact, I would be wary of both because oil sports a potentially bearish wedge and prices are in the 50-61.8% retracement zone.
Focus on the True Leaders
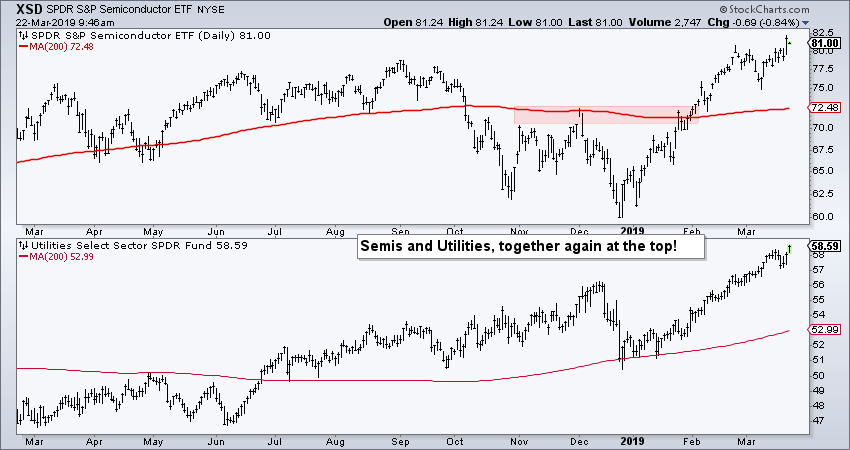
As chartists, we have a choice, lots of choice, in fact. We can focus on charts in the middle of the market, like the ones above, or we can focus on charts that show true leadership. Indexes, ETFs and stocks that are above their rising 200-day SMAs and close to 52-week highs are the true leaders. Think XLRE, RYT, XLK, XLU, FDN, SKYY, IGV, HACK, SOXX, XSD and IHI. This is a motley crew, but this is the crew that put the S&P 500 within 3% of an all time high this week. While they may not be ripe for positions now, they are the ones we want on our radar for bullish setups such as falling flags and short-term oversold conditions.
S&P 500 Maintains Uptrend
The S&P 500 surged over 1% on Thursday and recorded a new high for the year (2019). This bellwether index moved further above the slightly rising 200-day SMA and the 20-day SMA moved further above the 200-day SMA. I could mark the early March low as critical support, but my stance on the market is not driven by support levels (or resistance levels for that matter). I will remain bullish on the index as long as the 20-day holds above the 200-day.
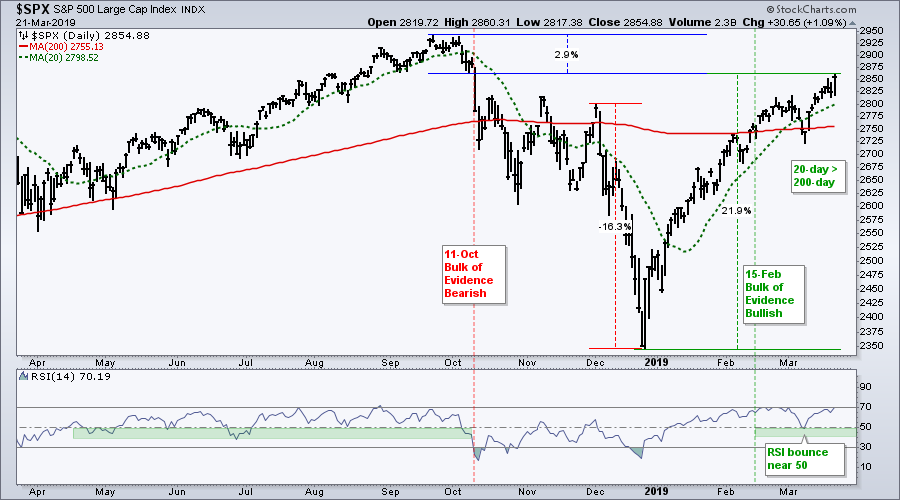
I do not consider the September high as a critical level because the bulk of the evidence is bullish and the trend is up. Higher highs are expected under current conditions so a break above the September high would be normal.
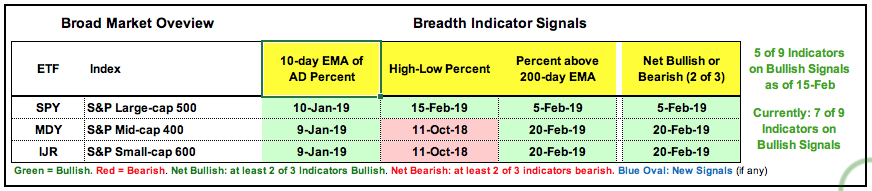
Index Breadth Table Remains Bullish
There is no change to the breadth signals for the broader market. Seven of the nine remain bullish and five of the nine (majority) have been bullish since February 15th. S&P 600 High-Low% ($SMLHLP) remains the big laggard, followed by S&P 400 High-Low% ($MIDHLP). Neither has exceeded +6% this year. Meanwhile, strength within technology and healthcare propelled S&P 500 High-Low Percent to +11.6% on Thursday. Large-caps continue to lead the new high list and this is where the real leaders reside.
Sector Breadth Table is More Mixed
There were four new signals on the sector breadth table, but no change overall because two were bearish and two were bullish. Finance triggered bullish as the 10-day EMA of AD Percent surged above +30% on March 15th, but this was offset as Finance %Above 200-day EMA (!GT200XLF) dipped below 40% on March 20th. Talk about a messed up sector. Elsewhere there was a bullish breadth thrust for the Energy SPDR and new lows expanded in the Communication Services SPDR. All told, there are still 27 active bullish signals (out of 33 possible) and the bulk of the evidence is clearly bullish.
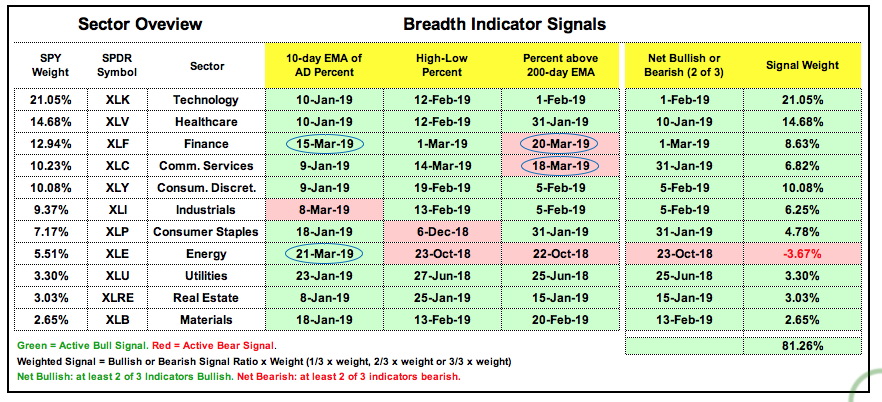 Note that the "signal weight" in the last column equals the sector weight multiplied by the bullish/bearish signal ratio. XLK has three active signals so its weight (21.05%) is multiplied by 3/3 (21.05 x +3/3 = +21.05). XLF has two active bullish signals so its weight is multiplied by 2/3 (12.94% x +2/3 = +8.63%). XLE has two active bearish signals so its weight is multiplied by -2/3 (5.51% x -2/3 = -3.67%).
Staples, Utilities, REITs and Tech Lead
Outside of utilities and REITs, the EW Technology ETF (RYT) is the only equal-weight sector to hit a new high on Thursday. Among, the sector SPDRs, the Technology SPDR (XLK) is the closest to a new high (less than 1%).
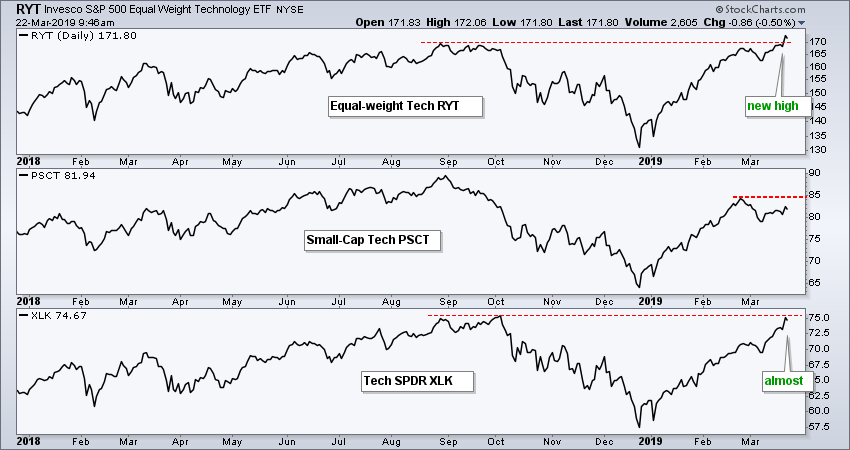
The Consumer Staples SPDR (XLP) is the next closest (less than 2% from a new high). For reference, the S&P 500 SPDR (SPY) is around 2% from its September high. From a price standpoint, utilities, REITs, staples and technology are the leading sectors. The table below ranks the 11 sector SPDRs and the 10 equal-weight sector ETFs by the percent from their 52-week high.
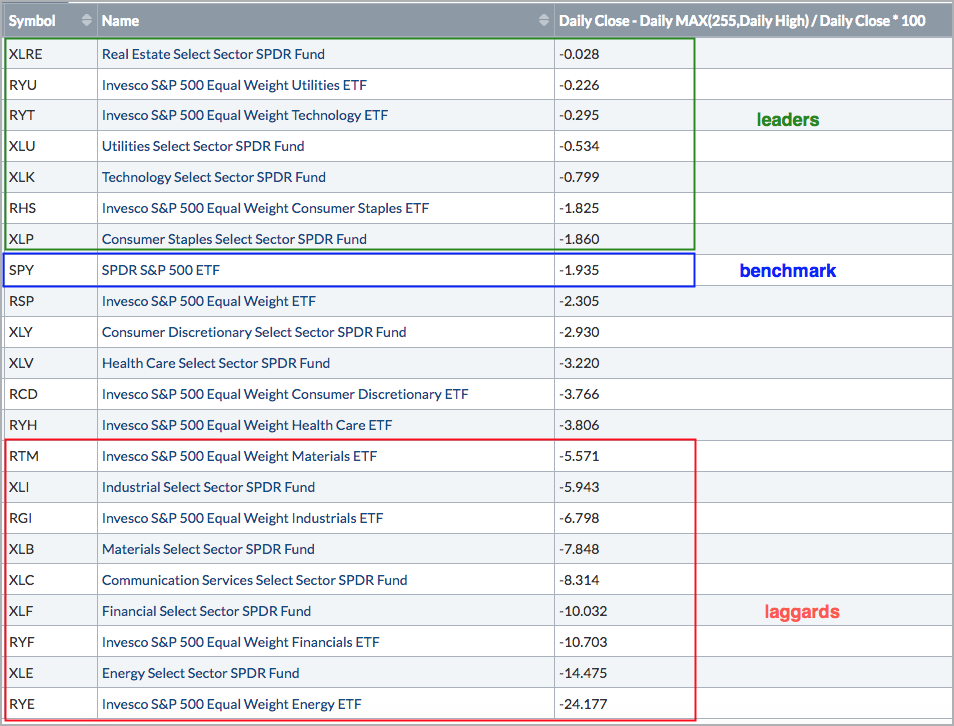
Chartists looking for leaders should be focusing on the top sectors and avoiding the bottom sectors. While it may seem as these bottom sectors have more room for upside, momentum and new highs are the game when it comes to stocks. Technology clearly has both right now. Elsewhere, perhaps healthcare as the potential for some mojo because it is not in the lagging group.
Bonds Extend on Breakout
The 7-10 YR T-Bond ETF (IEF) and the 20+ YR T-Bond ETF (TLT) were added to the ChartList on March 8th as IEF broke out of a bullish continuation pattern. There was clear follow through this week as unadjusted IEF (_IEF) surged again on Wednesday and hit a 52-week high. This move points to higher bonds prices and lower Treasury yields in the coming weeks and months. In fact, the 10-yr T-Yield appears headed for 2%.
ChartList Updates
- 20-March: IAC added (commentary link)
- 21-March: RWM added (commentary link)
- 22-March: DIS removed
The Art's Charts ChartList focuses on stocks and ETFs with stable uptrends and strong momentum. I take a portfolio approach (20-30 positions) to spread risk and keep position sizes relatively small (3-5%). I do not know which picks will work and which will fail. There will be failures and successes as well as slumps and streaks. Hopefully, when measured on a monthly or quarterly basis, the successes will outpace the failures and the net will be positive.
Disney Removal
Disney was added on February 20th with the flag breakout, but did not follow through and ultimately formed a lower high. The stock broke below the 200-day SMA and February low this week. Thus, DIS clearly lost any upside momentum it had and is not a leader. I am removing it from the ChartList.
Short Russell 2000 ETF Added
The Short Russell 2000 ETF (RWM) was added on March 21st with the wedge breakout. Note that IWM broke wedge support. Stocks surged on the 21st and RWM fell back to the breakout area. Could be just post Fed noise. RWM remains above Tuesday's low and IWM remains below Tuesday's high (and the 200-day) SMA. I will re-revaluate the RWM position on a close below 40.
I am not looking for make specific buy/sell recommendations in the Art's Charts ChartList. I added stocks and ETF when I see a setup that makes sense, at least to me. I remove when this setup fails or the rational for the position does not make sense. The term used is "re-evaluation". As an end of day kind of guy, I am only interested in closing prices, not intraday swings. Thus, a breach of the re-evaluation level means a rethink is needed. Keep in mind that you, and only you, are responsible for your trading decisions.
Questions, Comments or Feedback?
I do not take symbol request and I cannot promise to response to all correspondence, but I will read it and take into under consideration. I greatly appreciate all feedback because it helps me improve the commentary and provides ideas for the future.

Plan Your Trade and Trade Your Plan.
- Arthur Hill, CMT
Senior Technical Analyst, StockCharts.com
Book: Define the Trend and Trade the Trend
Twitter: Follow @ArthurHill


