- RSI Holds Bear Range for S&P 500
- A Classical Reversal Area for Russell 2000
- Small-cap Breadth Indicators Flip
- Selling Pressure in Key Groups
- ChartList Updates
RSI Holds Bear Range for S&P 500
The S&P 500 remains above its slightly rising 40-week SMA, but this key benchmark has gone nowhere since January 2018 (60 weeks). $SPX is trading near its January 2018 high and below its September 2018 high. The short-term trend remains up and the low three weeks ago is the key level to watch going forward (green zone). A weekly close below this low would reverse the upswing since late December and break the 40-week SMA.
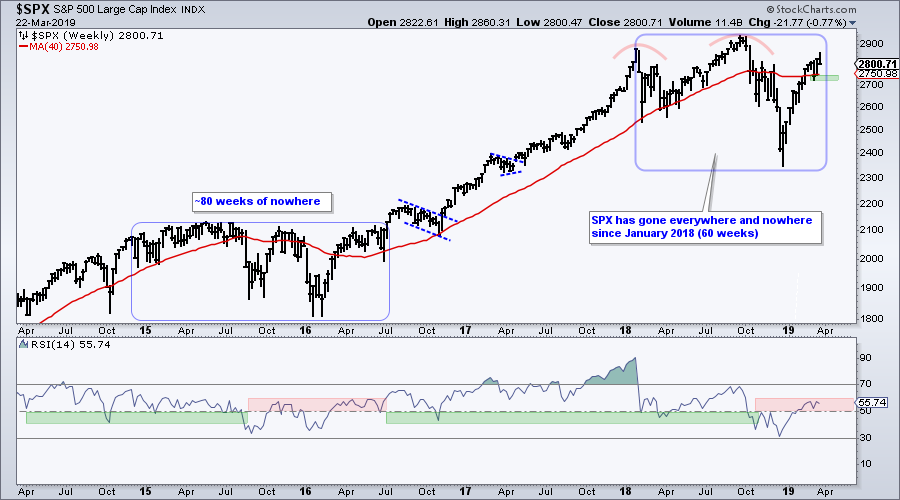
The indicator window shows RSI with a bearish configuration. The green areas mark bull range support in the 40-50 zone and the red areas mark bear range resistance in the 50-60 zone. RSI broke its bull range in October and has yet to exceed 60. Thus, RSI remains in a bear range. Another move below 50 would signal a downturn in momentum.
Even though the S&P 500 has yet to reverse its upswing, a look at the last two swings suggest we prepare to buckle up. From peak to trough, the index fell over 20% in 14 weeks (Oct-Dec) and then surged over 20% in 12 weeks.
A Classic Reversal Zone for Russell 2000
Large-caps are still holding up, but small-caps are breaking down and there is some classic technical analysis at work on the Russell 2000 chart. The bounce from December to February has the hallmarks of a counter-trend bounce within a bigger downtrend. First, the index fell sharply from October to December with two steps down. Second, the index rebounded back to the 61.8% retracement area with what looks like just one step up. This is the reverse of two steps forward and one step backward. The index met resistance near this retracement, the November high and the falling 40-week SMA. $RUT fell sharply three weeks ago, feebly rebounded two weeks ago and resumed its decline with a sharp move lower last week. Thus, it looks like the long-term downtrend is resuming here.
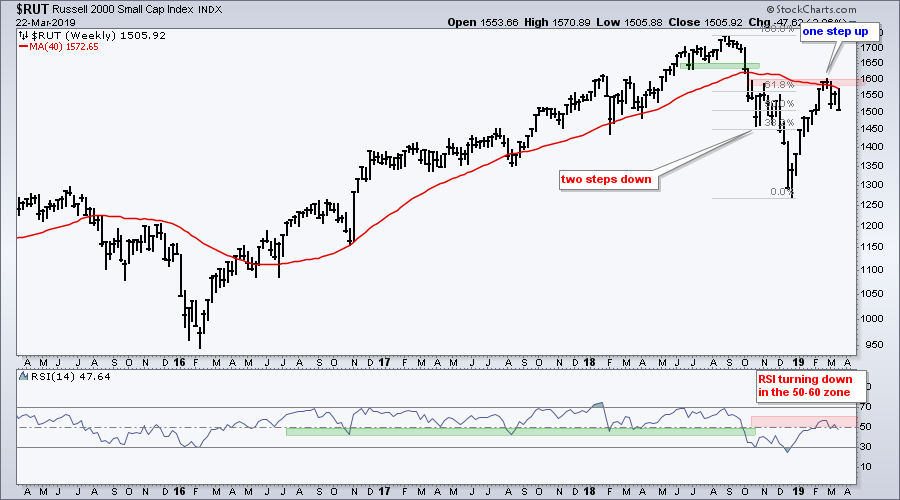
The indicator window shows 14-week RSI holding the 40-50 zone from mid 2016 until October 2018. Notice how the index trended higher when RSI ranged from 40 to 80. RSI broke this range in October and is now failing in the 50-60 zone. Thus, the bear range is set from 20 to 60 and RSI is in bear mode until it breaks above 60.
Small-cap Breadth Indicators Flip
The S&P Small-Cap 600 breadth indicators turned net bearish (2 of 3) as the Small-Cap %Above 200-day EMA (!GT200SML) moved below 40% on Friday. Note that a bullish breadth thrust triggered in early January when the 10-day EMA of AD Percent moved above +30% and a second bullish signal triggered when the %Above 200-day EMA exceeded 60% on February 20th. Two of the three were net bullish on February 20th. This bullish signal reversed on Friday because two of the three indicators are now on active bearish signals.
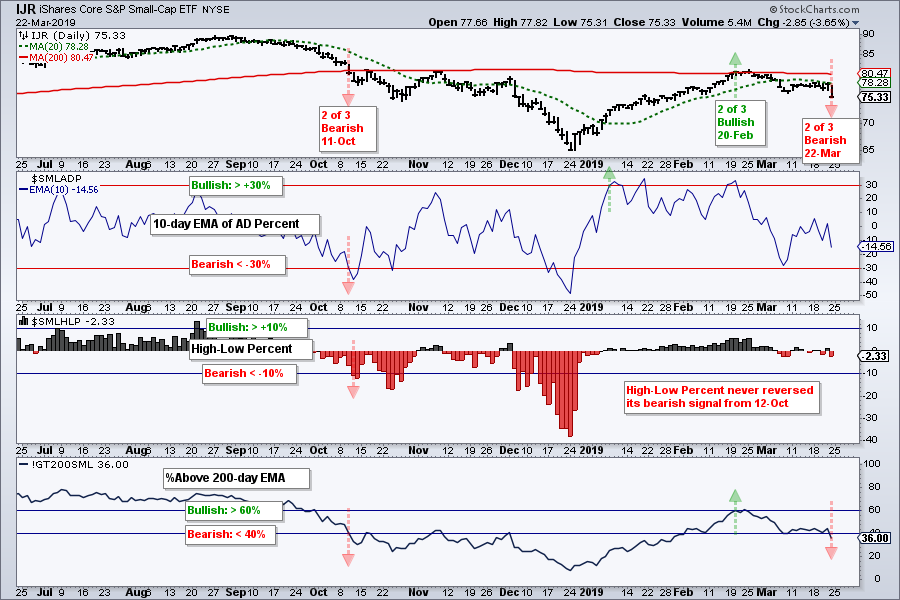
S&P 600 High-Low% ($SMLHLP) triggered bearish on October 12th and remained bearish in 2019 because it did not exceed +10%. Thus, the bull chair for small-caps was missing a leg. In addition, notice that the 20-day SMA never got back above the 200-day EMA and the S&P SmallCap iShares (IJR) did not exceed its November high. IJR began to weaken in late February and is now down over 5% from the late February high.
Small-caps represent the high risk end of the stock market and selling pressure in this group shows risk aversion.
For those new to these breadth indicators, here is a recap of the rationale and signals. There are three breadth indicators on this chart. The 10-day EMA of AD Percent is designed to identify a breadth thrust. A surge above +30% is a bullish breadth thrust, while a plunge below -30% is a bearish breadth thrust. High-Low Percent is used to identify the percent of stocks in strong uptrends (52-week highs) and strong downtrends (52-week lows). A move above +10% is bullish, while a move below -10% is bearish. I do not use the zero line for signals because there are too many whipsaws and I am looking for a definitive signal. The percentage of stocks above the 200-day EMA is used to quantify overall uptrends. A move above 60% is bullish and a move below 40% is bearish. I do not use 50% for signals because there are too many whipsaws and I am looking for a more definitive signal.
Selling Pressure in Key Groups
As noted in Friday's commentary, I am not concerned with "relative" weakness when it comes to key groups, such as small-caps, retailers, homebuilders and banks. I do not consider it a broad market problem if they are going up less than the broader market or other groups. Buying pressure is still stronger than selling pressure when prices rise, no matter how slow the rise.
The problem starts when prices decline in these key groups and we see absolute weakness. This means selling pressure is stronger than buying pressure. Selling pressure in small-caps, retailers, homebuilders and banks is an issue for the broader market.
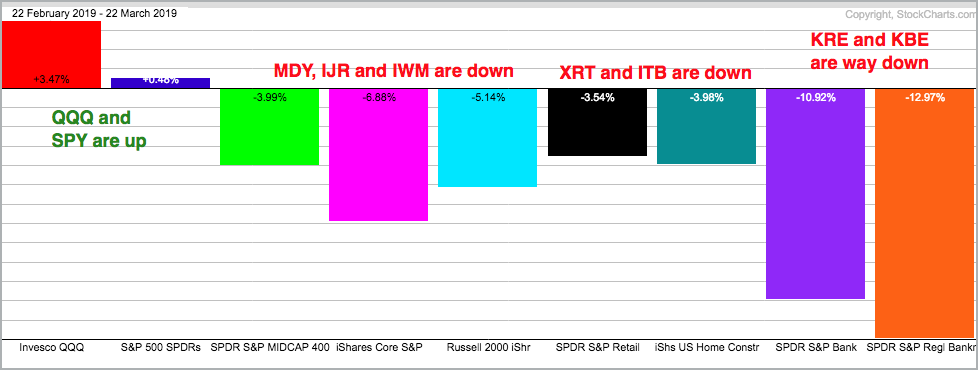
The PerfChart below shows QQQ and SPY with gains over the last four weeks, but the other seven symbols sport sizable losses. $SML is down around 7%, the Retail SPDR (XRT) is down around 3.5% and the Home Construction iShares (ITB) is down around 4%. The Bank SPDR (KBE) and the Regional Bank SPDR (KRE) are down double digits.
ChartList Updates
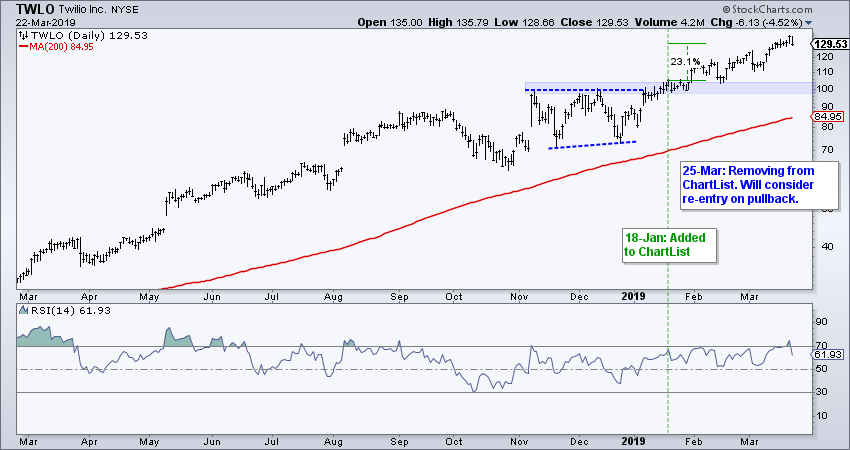
I am removing several stocks from the Art's Charts ChartList (here). Some have had good runs, such as PYPL and TWLO. Some are back to breakeven, such as FNSR. As noted in Friday's commentary, absolute weakness in small-caps and several key industry group ETFs show some risk aversion in the stock market. The S&P Small-Cap 600 and S&P Mid-Cap 400 look like they are still in long-term downtrends, while the S&P 500 could be vulnerable to a retracement of the December-March surge, or more.
The chart below shows Twillio, which is clearly one of the leading stocks because it hit a 52-week high on Thursday. I would hold if I were willing to ride it back to the 100 area. Also keep in mind that this stock could fall back to the low 90s and still be in a long-term uptrend. At this stage, my preference is to step aside and wait for the next setup.
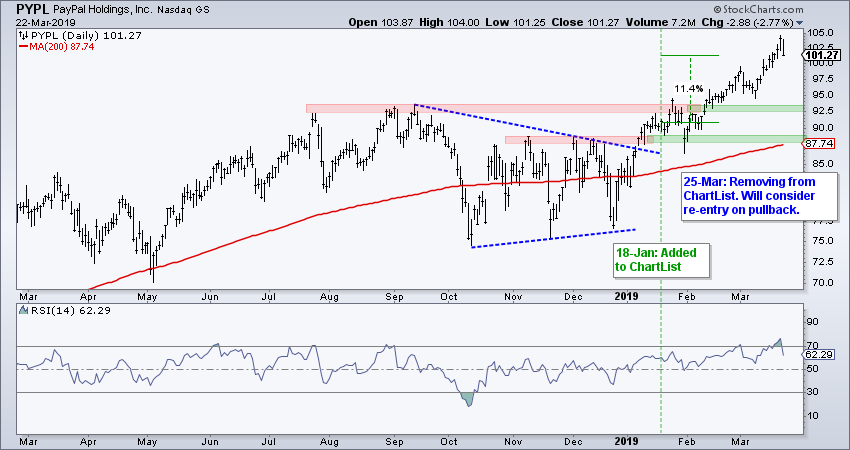
Paypal is also a leader and in a sub-industry group with secular growth (electronic payments). Despite a new high and long-term uptrend, this stock could pull back to the broken resistance in the 93 area or even broken resistance in the upper 80s, and still be in a long-term uptrend. This is the choice right now: prepare for a pullback or step aside.
These stocks are being removed from the Art's Charts ChartList.
- PYPL
- TWLO
- VRSN
- WDAY
- FTNT
- MSFT
- FNSR
On Trend on YouTube - Thursday 21-Mar
3 Big Sectors and Small-Caps Weaken
- Three Big Sectors Weaken in March
- Housing, Retail and Banks Turn Down
- A Bearish Setup for IWM (comparing RWM)
- Bond Market Leads the Fed
- Dynamic Yield Curve
- Click here to Watch
- Arthur Hill, CMT
Senior Technical Analyst, StockCharts.com
Book: Define the Trend and Trade the Trend
Twitter: Follow @ArthurHill


