- The First Pullback of the Year.
- A Big Drawn-out Range.
- Index Breadth Table Update.
- Sector Table Update.
- Finance Fails below November High.
- Retail and Banks Get Pummeled.
- A Bullish Continuation for Bonds.
- ChartList Updates.
 ... The First Pullback of the Year
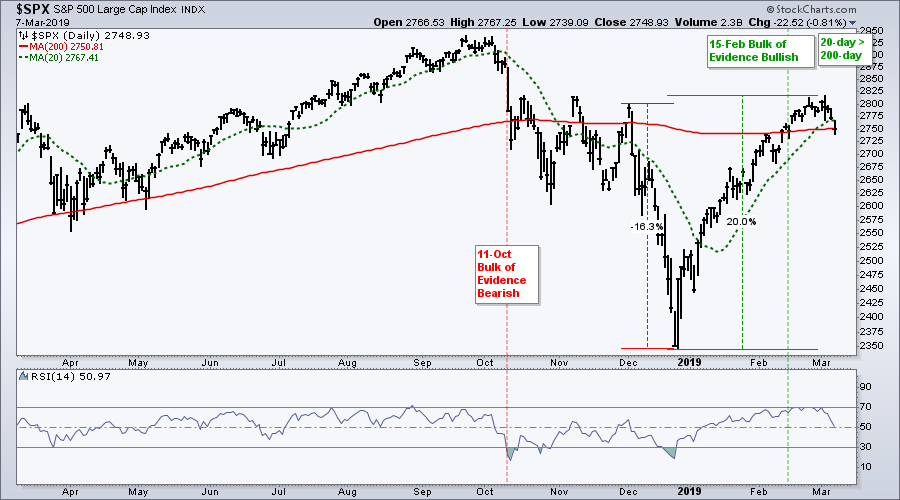
... The S&P 500 fell the last four days and is down around 2% on a closing basis. On the way, the index broke the 20-day SMA and closed just below the 200-day SMA on Thursday. As the index and sector breadth tables below show, the bulk of the evidence turned bullish in mid February and remains bullish. In addition, the 20-day SMA is above the 200-day SMA. This is the first indicator I would watch for a signal that a bigger reversal possible. Here is an article explaining the rational for these two MAs.
A Big Drawn-out Range
Let's play a little "What if" to see what the bears may be seeing on the charts. The chart below shows weekly prices with the three week plunge below 2400 whited out somewhat. The index broke support and then recouped this support break quite quickly. Overall, it still looks like a bear trap and support zone.
With or without the plunge to new lows, we can see that the S&P 500 has gone everwhere and nowhere since January 2018. The index peaked at 2873 in January 2018 and has yet to exceed 2850 this year. In between, the index peaked just above 2900. Given the support zone in the 2530-2600 area, the first peak could mark the left shoulder and the second could mark the head of a head-and-shoulders reversal. This means the right shoulder could be forming here in March. Again, watch the 20-day and 200-day SMAs on the daily chart for the first sign of a significant downturn.
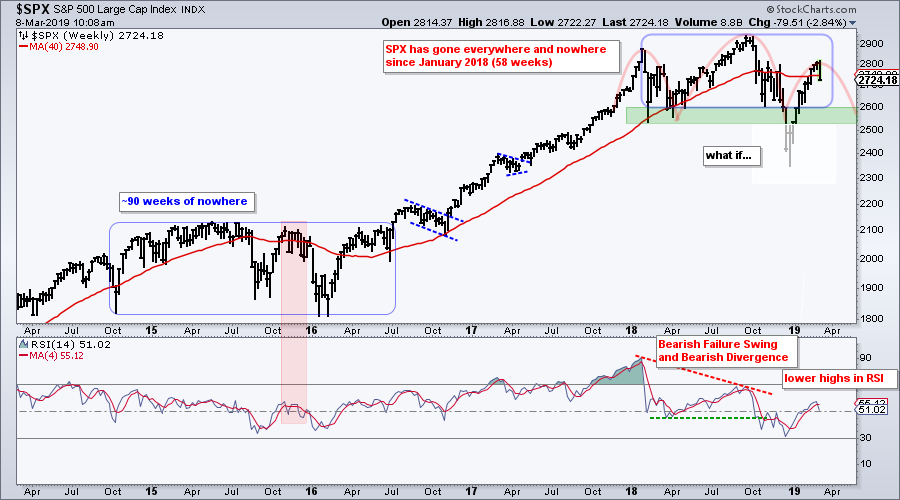
The indicator window shows 14-week RSI with the 4-week SMA for smoothing. First, notice that RSI formed a big failure swing and bearish divergence from January to October. See this ChartSchool article for more on RSI signals. RSI moved back above 50 at the end of January and the 4-week SMA crossed above 50 in early February. Moves back below 50 in these two would signal that prices are turning down again.
Index Breadth Table Update
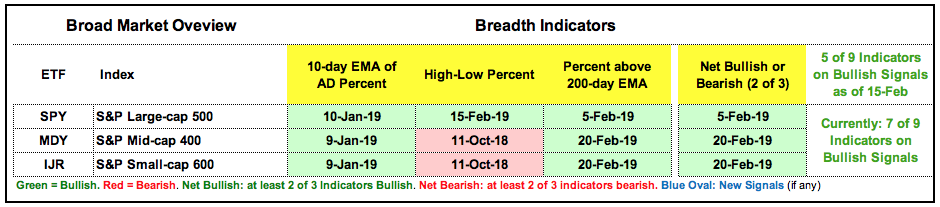
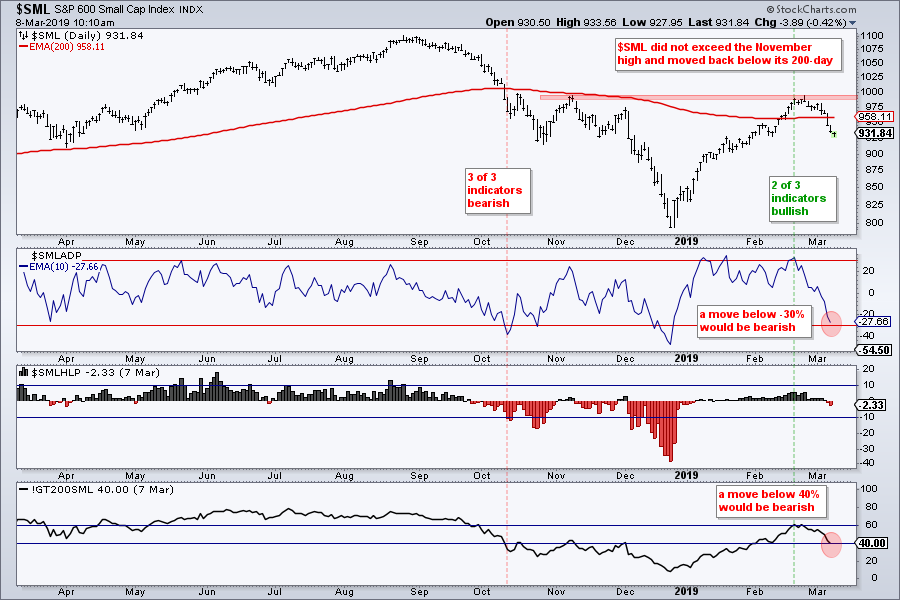
There is no change to the breadth table for the major indexes and the majority of indicators are on bullish signals (7 of 9). However, the Small-Cap %Above 200-day EMA (!GT200SML) fell to 40% and the 10-day EMA of S&P SmallCap AD Percent ($SMLADP) fell to -27.66%. It would not take much more weakness for these two to trigger bearish.
Sector Table Update
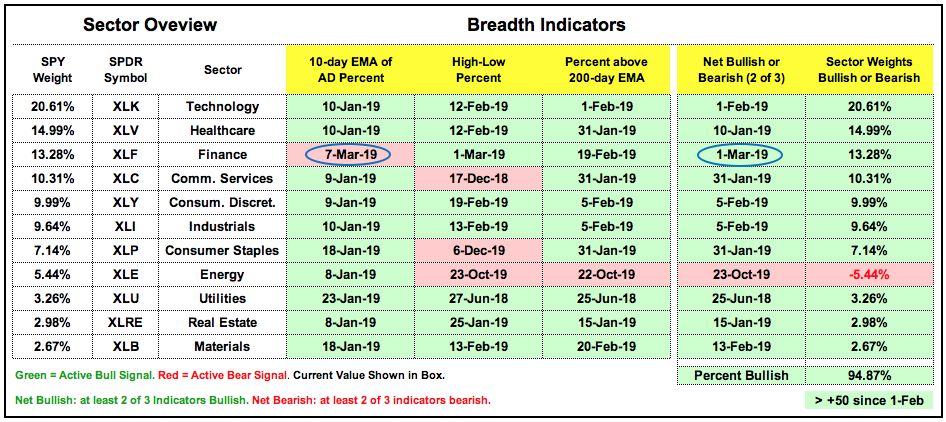
The S&P 500 sector table remains bullish overall, but the Energy SPDR (XLE) remains net bearish and the 10-day EMA of XLF AD Percent ($XLFADP) exceeded -30% to trigger bearish. Two of the three breadth indicators for XLF remain bullish, but the Finance %Above 200-day EMA (!GT200XLF) fell to 44%. Further weakness below 40% would turn two of three indicators bearish for finance.
Finance Fails below November High
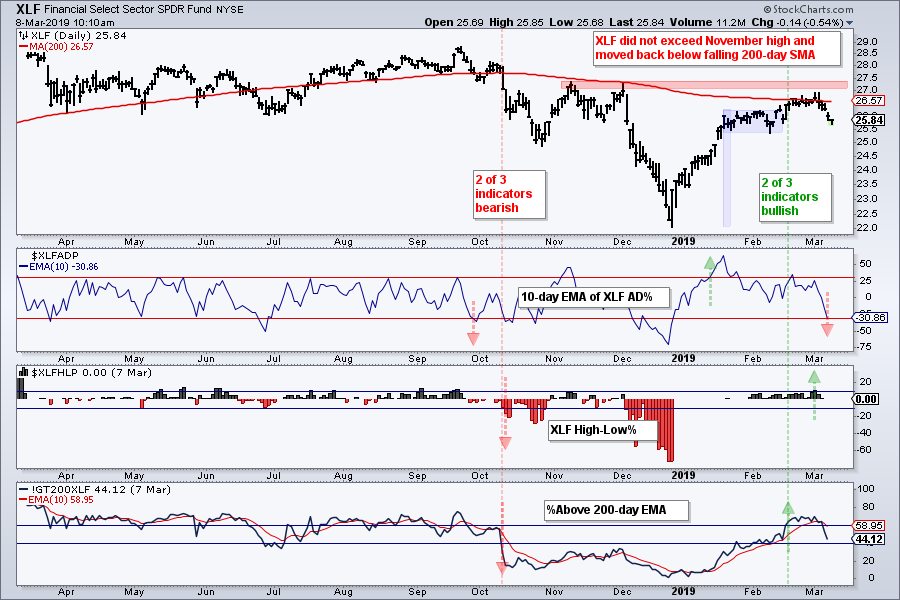
The chart below shows the Financials SPDR failing to exceed the November highs and moving back below its falling 200-day SMA. The flag breakout was the working pattern on this chart, but now I must default to weakening breadth and the failure below the November high (and 200-day SMA). The evidence shifting back to bearish for finance.
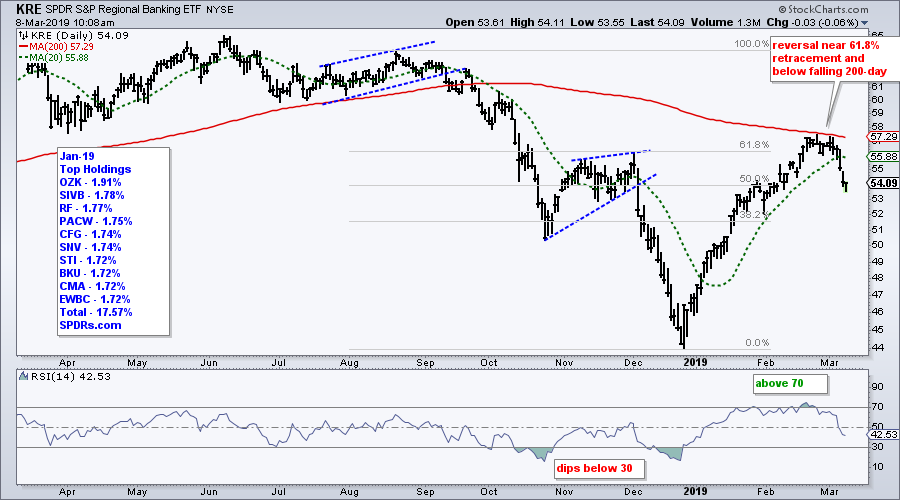
Retail and Banks Get Pummeled
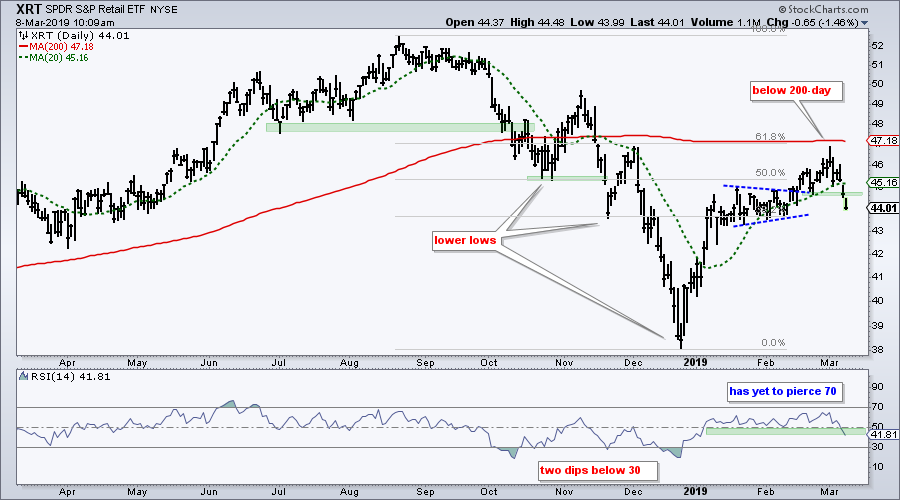
The Retail SPDR (XRT) and the Regional Bank SPDR (KRE) were hit hard the last four days. A sharp decline in and of itself is not always bearish, but this decline looks ominous because of where it is occurring. There is nothing magical about Fibonacci retracements. Sometimes they work and many times they don't. Note that Charles Dow theorized that counter-trend moves often retrace one third to two thirds of the prior move with half (50%) marking the base case. These numbers align near the 38.2% and 61.8% retracements. Thus, when I mark a 61.8% retracement, I am thinking Charles Dow and the 66.67% retracement too!
The charts below show XRT and KRE turning lower near the 61.8% retracements and the 200-day SMAs. Keep in mind that both fell sharply from August to December and recorded new lows in late December. The decline over the last few days also broke the 20-day SMAs and this suggests that the short-term uptrend has reversed. It is also possible that the advance from late December to late February was a massive counter-trend bounce and the bigger downtrend is resuming.
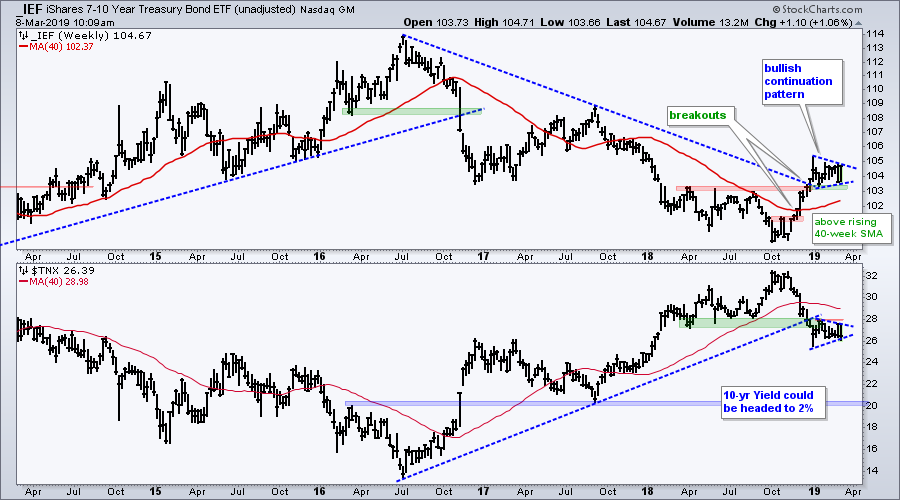
A Bullish Continuation For Bonds
A pending breakout in the 7-10 YR T-Bond ETF (IEF) and breakdown in the 10-yr T-Yield ($TNX) is another reason to be cautious on US equities. Bonds rise and yields fall when the economic outlook dims and this could be negative for equities. The chart shows IEF breaking out with a surge from October to January. This breakout held as the ETF then consolidated with a small triangle or pennant, which is a bullish continuation pattern. With this week's surge, it looks like IEF is poised for a breakout and a continuation of this uptrend.
ChartList Updates
With U.S. stocks looking vulnerable, but not yet bearish because the S&P 500 is holding up, I am going to lighten up quite a bit. EIDO and EPHE moved lower the last 4-5 weeks and started weakening before US stocks. EWS and EEM have gone nowhere the last 7-8 weeks, even though Chinese stocks surged. These four international ETFs are being removed. In addition, I am removing the following stocks. The breakouts in VRTX and SCWX failed miserably. AMD broke below the mid February low. EXPE did not recover from last week's gap down and PFE was hit a lot harder than MRK and LLY. DATA is still in an uptrend, but appears to be losing upside momentum.
190308: Remove DATA, EXPE, PFE, VRTX, FOXF, AMD and SCWX
190308: Add IEF and TLT (see above)
Click here for the Art's Charts ChartList
The Art's Charts ChartList focuses on stocks and ETFs with stable uptrends and strong momentum. I take a portfolio approach (20-30 positions) to spread risk and keep position sizes relatively small (3-5%). I do not know which picks will work and which will fail. There will be failures and successes as well as slumps and streaks. Hopefully, when measured on a monthly or quarterly basis, the successes will outpace the failures and the net will be positive.
Questions, Comments or Feedback?
I do not take symbol request and I cannot promise to response to all correspondence, but I will read it and take into under consideration. I greatly appreciate all feedback because it helps me improve the commentary and provides ideas for the future.

Plan Your Trade and Trade Your Plan.
- Arthur Hill, CMT
Senior Technical Analyst, StockCharts.com
Book: Define the Trend and Trade the Trend
Twitter: Follow @ArthurHill


