- S&P 500 Stalls within Uptrend.
- Upswing Dominates Weekly SPX Chart.
- Index Breadth Table Remains Bullish.
- IJR: Failure at 200-day or Mere Correction?
- Sector Table - Staples Get a Lift.
- XLI Hits Make-or-break Zone.
- UTX Consolidates around the 200-day.
- MMM Consolidates above 200-day.
- Palladium Takes a Tumble.
- ChartList Updates.
- About the Art's Charts ChartList.
 ... S&P 500 Stalls within Uptrend
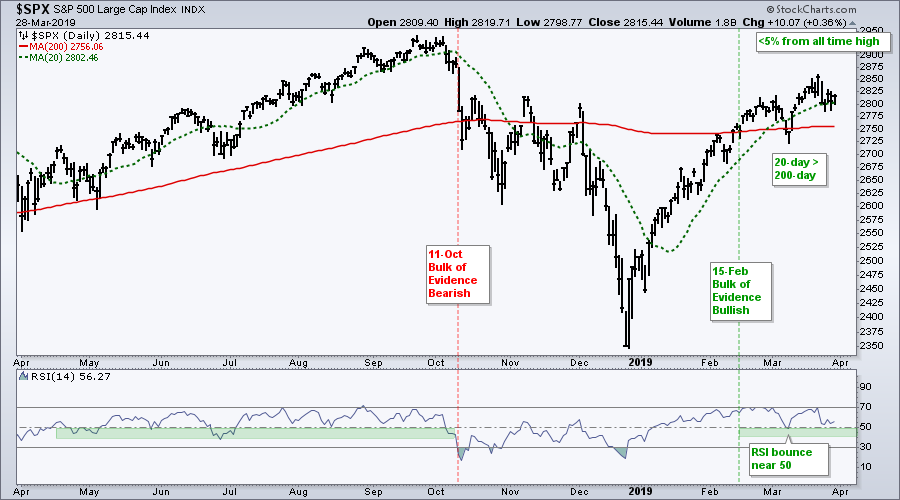
... The S&P 500 fell back a week ago Friday and then stalled this week. Overall, the index continues to hold above its slightly rising 200-day SMA and the 20-day SMA is above the 200-day SMA. In addition, the index is less than 5% from its all time high and daily RSI remains in its bull zone. This is the most important benchmark for US stocks and the evidence noted above is bullish. In keeping with the present moment, I will simply accept this bullish chart until there is evidence to the contrary. Can we get a collective "ooooommmmm" on that?!
Upswing Dominates Weekly SPX Chart
We can always find something bearish, negative or concerning if we look hard enough. The weekly chart shows the index going everywhere and nowhere since January 2018. The index turned down at 2870 in January 2018 and in the 2950 area in September 2018. It is currently in the 2815 area and below the prior highs.
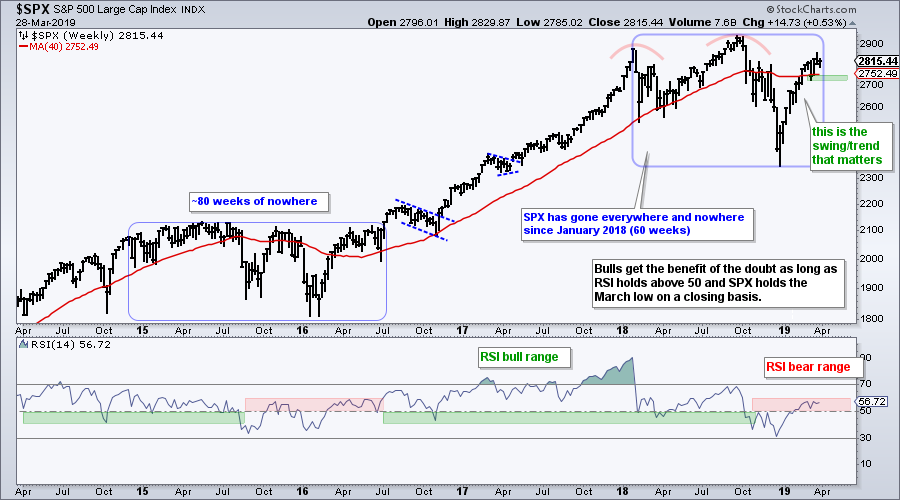
RSI is also in a bear range because it has yet to move above 60. Despite these not-so-bullish observations, I think the upswing since late December holds the key right now. This powerful swing included a breadth thrust and turned the breadth indicators net bullish in mid February. In addition, the index is holding above 2700 and above the slightly rising 40-week SMA. I will stay bullish and re-evaluate on a close below the early March low (green zone).
Index Breadth Table Remains Bullish
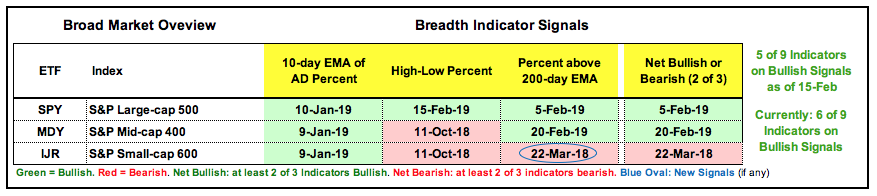
There is one change in the index breadth table: the Small-Cap %Above 200-day EMA (!GT200SML) moved below 40% last Friday to trigger bearish. Six of the nine indicators are currently bullish. All three indicators are bullish for the S&P 500, two of the three are bullish for the S&P Mid-Cap 400 and one of the three are bullish for the S&P Small-Cap 600. There are pockets of weakness in small-caps and mid-caps, but the weight of the evidence is bullish for the market as a whole.
IJR: Failure at 200-day or Mere Correction?
The S&P SmallCap iShares (IJR) and small-caps present us with a conundrum. The weight of the evidence is bullish on the breadth table and the S&P 500 chart is bullish. Thus, the broad market environment is considered bullish. In such an environment, I would normally ignore bearish setups and focus on bullish setups. However, the chart below clearly shows IJR hitting a reversal zone and turning down. Notice that the ETF turned lower at the 61.8% retracement, resistance from the Nov-Dec highs and the falling 200-day SMA. In addition, two of the three small-cap breadth indicators are on bearish signals.
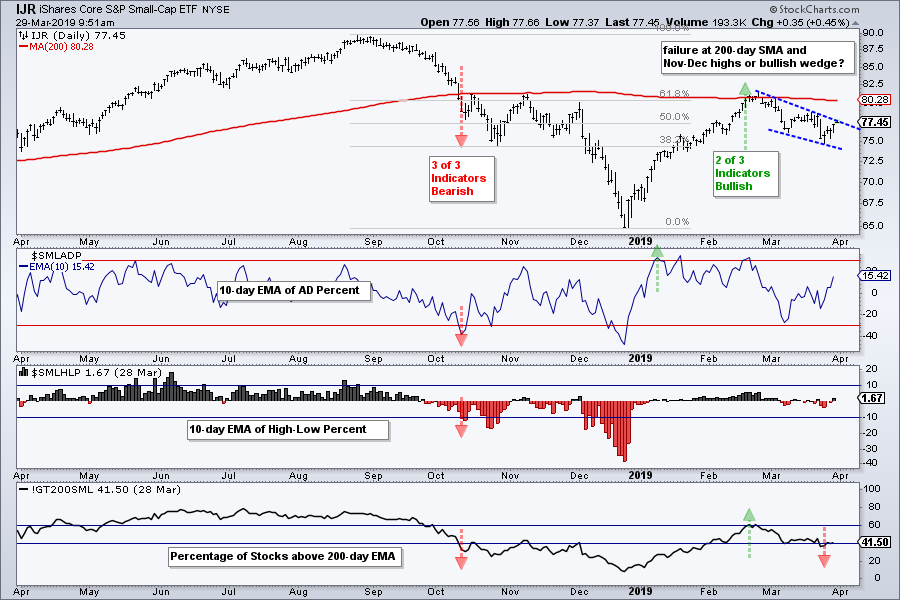
It is important to keep an open mind because anything can happen in the financial markets. Anything. The S&P 500 could break down or the S&P SmallCap iShares could break to the upside. With the broad market environment bullish, the falling wedge in IJR could be a mere correction after the big surge. A breakout here would reverse the March slide and signal a continuation of the January-February surge. Watch for a close above 78.50.
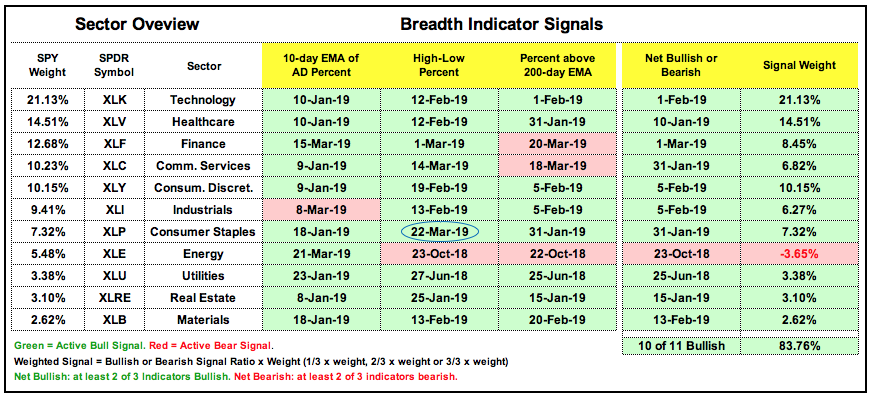
Sector Table - Staples Get a Lift
There is one change in the sector breadth table. XLP High-Low% ($XLPHLP) exceeded +10% last Friday (22-Mar) and all three indicators are now bullish for XLP. Overall, 28 of the 33 indicators are on bullish signals and 10 of the 11 sectors are net bullish (at least 2 of 3 indicators bullish). XLE is the only sector on a bearish signal.
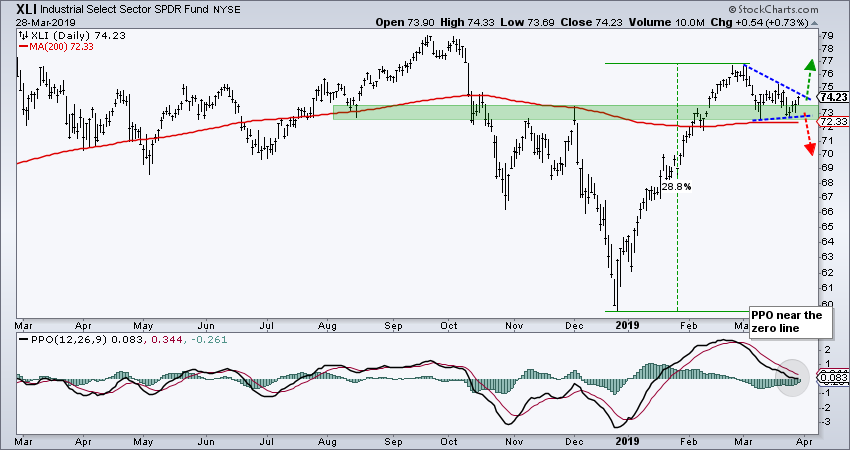
XLI Hits Make-or-break Zone
The Industrials SPDR (XLI) is trading in a make-or-break zone as it consolidates above the 200-day SMA. Notice that XLI broke above the November-December highs and 200-day SMA with a 29% surge. Some much for stodgy old industrial stocks. The ETF was quite extended at this stage and stalled with a triangle consolidation. This could be the pause that refreshes and a breakout at 75 would be bullish. On the flipside, a break below the 200-day SMA would be negative here. The indicator window shows MACD moving to the centerline (0) as XLI stalls. An upturn and signal line cross would be bullish here.
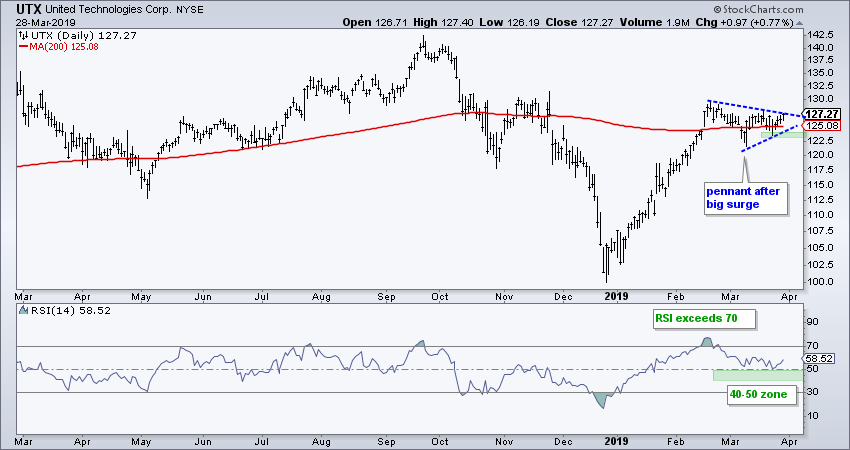
UTX Consolidates around the 200-day
The next chart shows United Technologies (UTX) with a surge back above the 200-day SMA and a pennant/triangle consolidation. As a bullish continuation pattern, a breakout at 128 would signal a continuation higher. RSI exceeded 70 during this surge and this showed strong upside momentum. RSI fell back to the 50 area and the 40-50 zone should act as momentum support. I will add UTX to the Art's Charts ChartList with a re-evaluation on a close below 123.
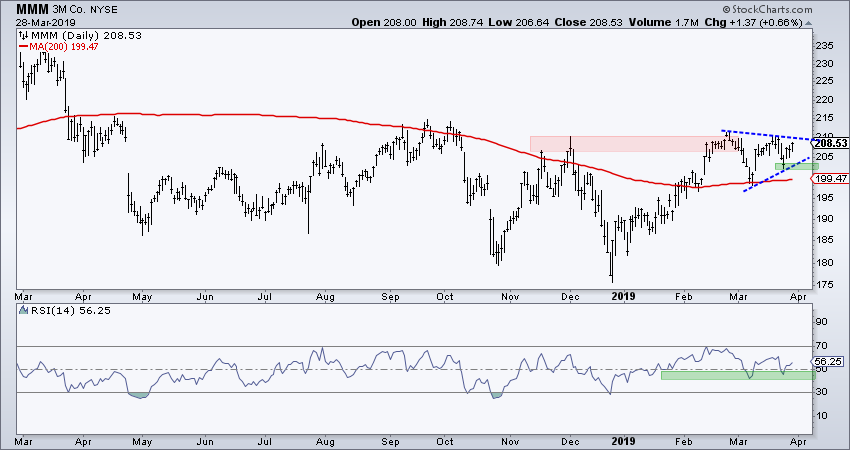
MMM Consolidates above 200-day
The next chart shows 3M (MMM) breaking above the 200-day SMA in February and this moving average turning up over the last few weeks. The stock also consolidated with a pennant/triangle and this should be viewed as a bullish continuation pattern. A breakout at 210 would open the door to further gains. The indicator window shows RSI touching 70 in mid February and hitting its highest level in over a year. This momentum indicator fell back to the 40-50 zone and firmed in March. I will add MMM to the Art's Charts ChartList with a re-evaluation on a close below 202.
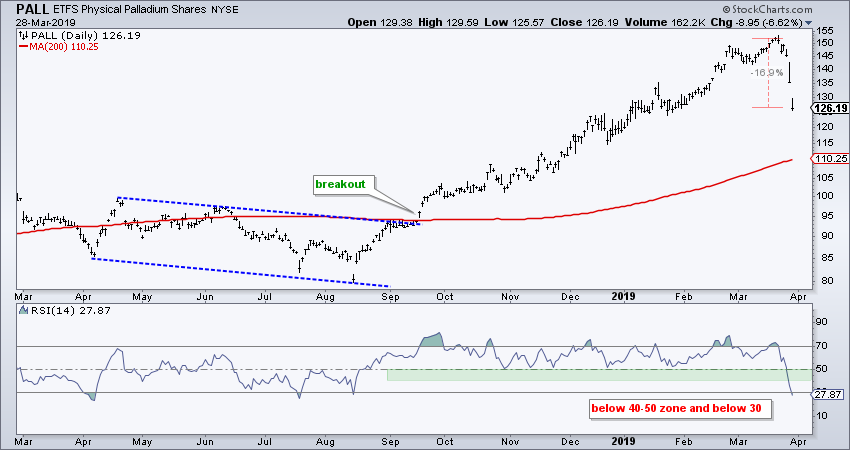
Palladium Takes a Tumble
The Palladium ETF (PALL) has been on my radar since the September breakout. It was featured in ChartWatchers on November 2nd and added to the ChartList on February 11th. PALL was in a steady uptrend from August 16th to March 20th and then got hit hard the last five days (-17%). I cannot predict such moves and I am not going to search for "the hindsight signal". However, I am going to remove it from the ChartList because the trend is broken. Even though PALL remains above the rising 200-day SMA, this decline is not part of a consistent and persistent uptrend. In addition, RSI moved below 30 to show strong downside momentum.
My work on trading strategies shows that performance can be improved with profit targets. A hindsight profit target around 150 would have worked well on PALL, but this is a moot point. In the future, traders can also consider taking profits on half the position and letting the other half ride, perhaps with an adjusted stop or another profit target. Booking some profits on an initial profit target can prevent the entire trade from turning into a loss.
ChartList Updates
I am re-reading "Trading in the Zone" by Mark Douglas. There are also some of his videos on Youtube. This is a great, if somewhat tedious, book on trading psychology. Among other takeaways, Douglas notes that individual trades are random events and we have no idea if a single trade will be successful or not. Even though we have no idea which individual trades will succeed or fail, our strategy tells us what to expect when reviewing dozens of trades. Thus, our strategy may suggest that 55% of trades will be winners and the profits from these will make up for the losses. We could have sequence of 5 losers, 7 winners, 5 losers and 7 winners. The sequence is also random, but the sum total of all trades is not random, provided the strategy works as expected.
Having clarified the randomness of each individual trade, there are recent changes to the ChartList:
- 29-March: UTX added
- 29-March: MMM added
- 29-March: PALL removed
- 27-March: VRTX added (commentary link)
- 27-March: IRM added (commentary link)
- 27-March: SYMC added (commentary link)
About the Art's Charts ChartList
The Art's Charts ChartList focuses on stocks and ETFs with stable uptrends and strong momentum. I take a portfolio approach (20-30 positions) to spread risk and keep position sizes relatively small (3-5%). I do not know which picks will work and which will fail. There will be failures and successes as well as slumps and streaks. Hopefully, when measured on a monthly or quarterly basis, the successes will outpace the failures and the net will be positive.
I am not looking for make specific buy/sell recommendations in the Art's Charts ChartList. I added stocks and ETF when I see a setup that makes sense, at least to me. I remove when this setup fails or the rational for the position does not make sense. The term used is "re-evaluation". As an end of day kind of guy, I am only interested in closing prices, not intraday swings. Thus, a breach of the re-evaluation level means a rethink is needed. Keep in mind that you, and only you, are responsible for your trading decisions.
Questions, Comments or Feedback?
I do not take symbol request and I cannot promise to response to all correspondence, but I will read it and take into under consideration. I greatly appreciate all feedback because it helps me improve the commentary and provides ideas for the future.

Plan Your Trade and Trade Your Plan.
- Arthur Hill, CMT
Senior Technical Analyst, StockCharts.com
Book: Define the Trend and Trade the Trend
Twitter: Follow @ArthurHill


