- S&P 500 Holds as Russell Rolls Over.
- Plenty of New Highs in $SPX.
- ChartList Updates - 3 Additions.
Are we in a bull market, a bear market or neither? At this point, the evidence is still more bullish than bearish, but there are clearly some pockets of weakness within the stock market. As noted on Monday, the S&P 500 and the S&P 500 Equal-Weight Index are still holding up and have yet to reverse their upswings, which started in late December.
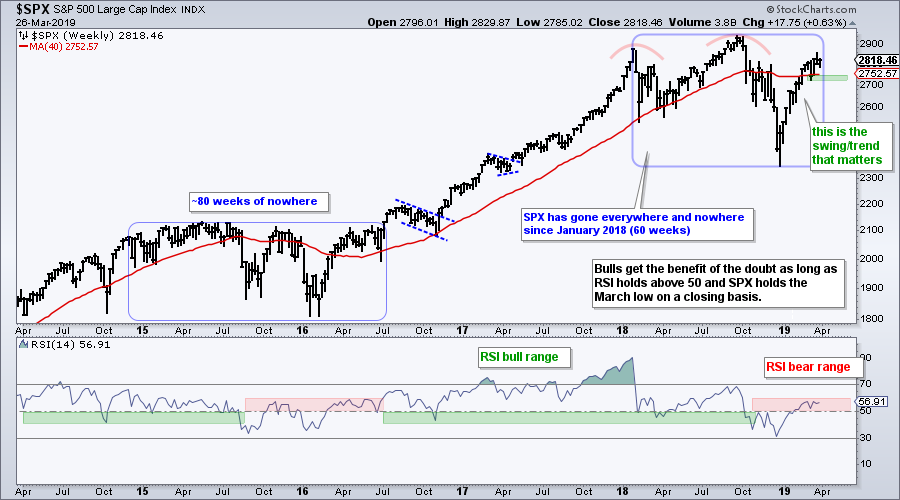
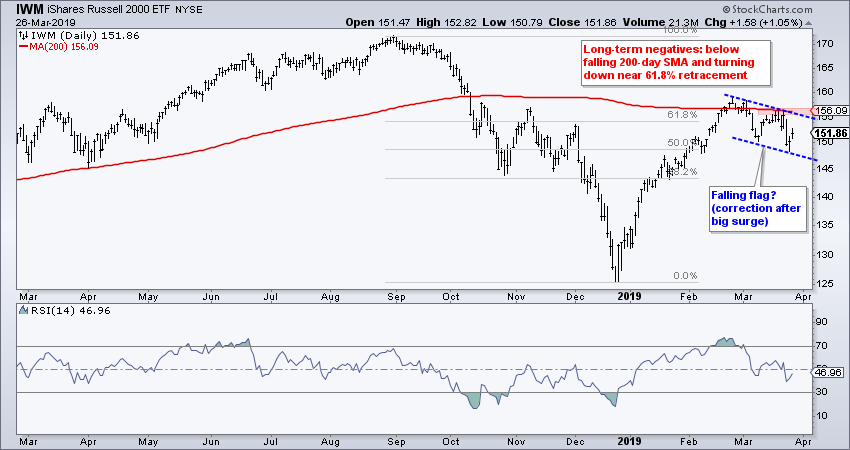
In contrast, the Russell 2000 iShares (IWM) reversed its upswing with a decline the last four weeks. The weekly chart looks bearish, but this decline could be a falling flag on the daily chart, which is a bullish continuation pattern. A breakout at 156 would be bullish.
There is something for bulls and bears alike in the current market. What else is new! Chartists with a bullish bias will lean towards bullish evidence, while chartists with a bear bias will lean towards bearish evidence. The key is to not have a bias, which is harder said than done. We all have biases, but we must make an effort to see what is really there in an objective manner by weighing the evidence. Forget the yield curve, the Fed, Mueller, Brexit, tariffs, politics and other noise. Instead, focus on the price charts and a few indicators. Clear your mind of noise and allow yourself to focus on that is really there! Sounds like a meditation course.
We need some sort of objective process when analyzing the markets. My process involves the S&P 500 with the 20-day SMA and 200-day SMA, and breadth indicators for the major stock indexes and sector SPDRs. This process is not fool proof, but it does give me an objective manner in which to make a market assessment. There are pockets of weakness in the market right now, but there are still more pockets of strength. As the table below shows, six of the nine breadth indicators are on bullish signals.
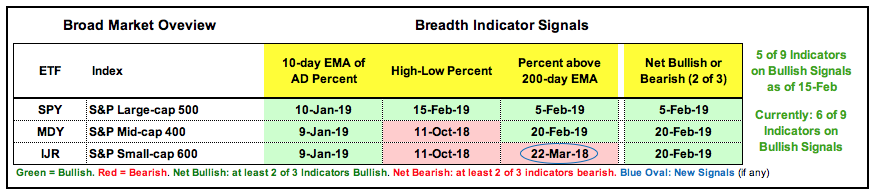
Thus, the market as a whole is mixed, but favoring the bulls. A mixed market is another way of suggesting that it is a stock picker's market.
Plenty of New Highs in $SPX
I ran a scan looking for S&P 500 stocks that recorded a 255 day high over the last five trading days. This is basically a 52-week high with a few days thrown in for good measure. The scan code is below and the results amazed me.
[group is SP500]
and [[today's high > yesterday's daily max(255,high)]
or [yesterday's daily high > 2 days ago daily max(255,high)]
or [2 days ago daily high > 3 days ago daily max(255,high)]
or [3 days ago daily high > 4 days ago daily max(255,high)]
or [4 days ago daily high > 5 days ago daily max(255,high)] ]
99 stocks in the S&P 500 recorded new highs within the last five days. This is around 20% of the index and this is more than enough to warrant a bullish bias. In other words, there are plenty of strong uptrends out there. 42 stocks in the S&P Mid-Cap 400 hit new highs within the last five days (~10%), but just 17 stocks in the S&P Small-Cap 600 hit new highs. Again, we see large-caps leading, mid-caps holding up and small-caps underperforming. Use [Group is SP400] for midcaps and [Group is SP600] for smallcaps.
ChartList Updates - 3 Additions
I scaled back on Monday by removing some charts from the ChartList. A bird in the hand is worth two in the bush. The weight of the stock market evidence still favors the bulls, but the degree is always open for debate. I am still seeing bullish setups after running my scans and looking through the charts. Biases aside, the strategy is to highlight bullish setups when the weight of the evidence is bullish. I am, therefore, adding three charts to the ChartList.
Programming note: I would probably add more charts, but I will be on the road the first week of April and on vacation the next two weeks (April 8 to 19). Note that I will be attending the CMT Association Symposium in NYC on April 4th and 5th. I am always up for a chat with StockCharts users so let me know if you will be there as well.

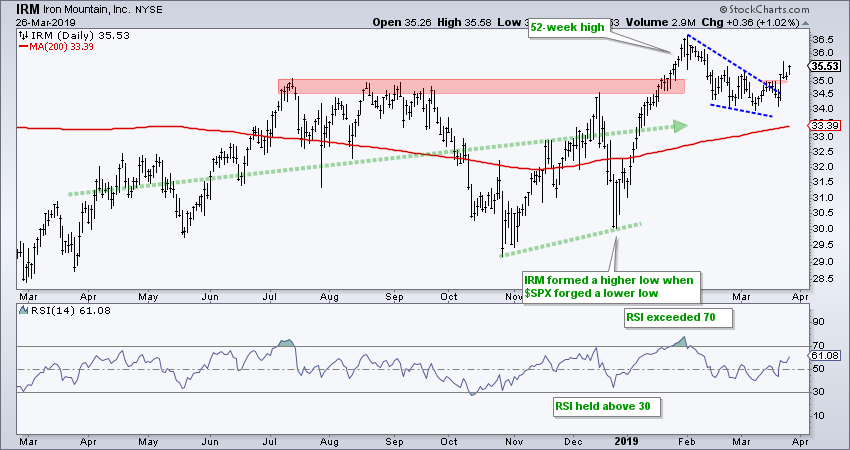
Iron Mountain (IRM) surged to a 52-week high in late January and then corrected into March with a falling wedge. The stock is above the rising 200-day SMA and the long-term trend is up. IRM broke out of the falling wedge with a surge last week and held up quite well on Friday. The breakout is holding and it looks like the bigger uptrend is continuing. The indicator window shows RSI holding the 40-50 zone in February-March and moving back above 60 this week. I would re-evaluate on a close below 34.
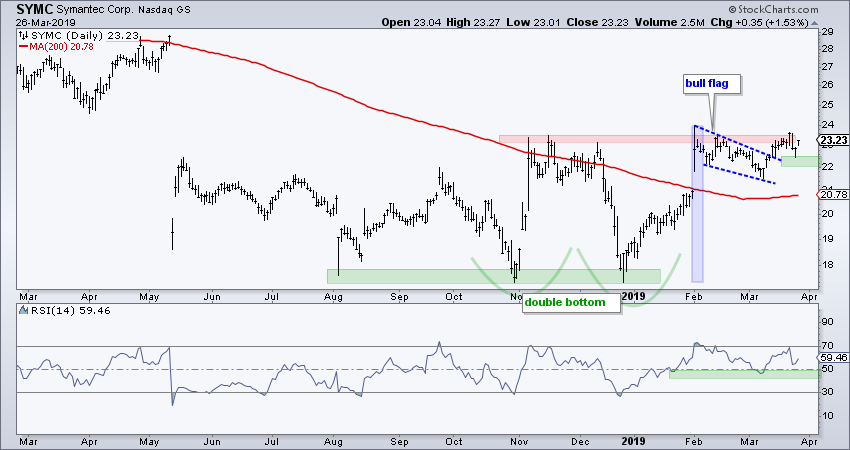
Symantec (SYMC) has a big double bottom working and the 200-day SMA turned up over the last few weeks. After surging to 24 in early February, the stock corrected into March with a falling flag/wedge and broke out in late March. The breakout is largely holding and the stock looks poised to clear double bottom resistance. I would re-evaluate on a close below 22.
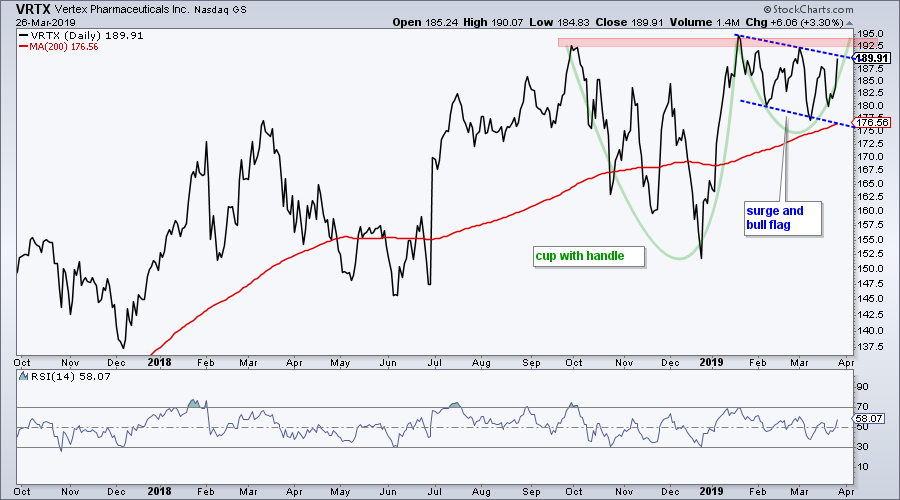
Vertex (VRTX) was on the ChartList in early March, but plunged below 180 to call for a re-evaluation. I am showing a line chart over the last 18 months for more perspective and less noise. The stock hit new highs in October and January, and is above the rising 200-day SMA. Pattern-wise, a bullish cup-with-handle is taking shape with rim resistance in the 195 area. The right half looks like a surge and bull flag with the stock poised to break flag resistance. I will add VRTX back to the ChartList with a re-evaluation on a close below 175.
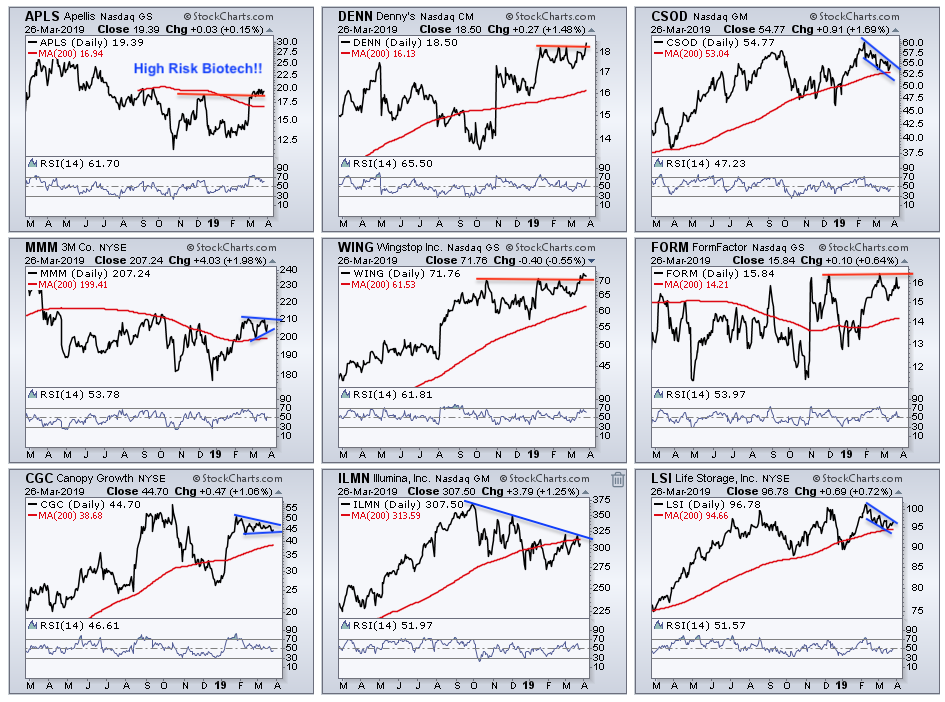
Other symbols on my watch list:
- APLS (double bottom and flag)
- DENN (breakout to new highs)
- CSOD (uptrend and falling wedge correction)
- MMM (consolidating above rising 200-day SMA)
- WING (cup-with-handle breakout and new high)
- FORM (cup-with-handle and above rising 200-day SMA)
- CGC (triangle consolidation after big surge)
- ILMN (just below rising 200-day SMA)
- LSI (pullback to rising 200-day SMA)
Are Small-caps Correcting or Continuing?
- Large-caps Hold Up ($SPX and $SPXEW)
- Russell 2000: Correction or Continuation?
- Small-cap Breadth Weakens Considerably
- Yield Curve Inversions the Last 45 Years
- Stocks to Watch
- Click here to Watch
- Arthur Hill, CMT
Senior Technical Analyst, StockCharts.com
Book: Define the Trend and Trade the Trend
Twitter: Follow @ArthurHill


