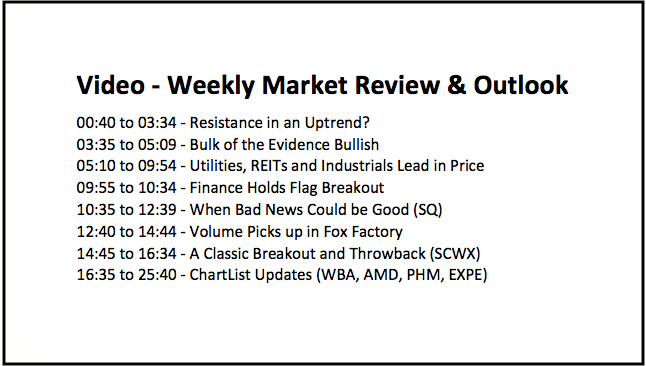
- Resistance in an Uptrend?
- Bulk of the Evidence Bullish.
- Utilities, REITs and Industrials Lead in Price.
- Finance Holds Flag Breakout.
- When Bad News is Good (SQ).
- Volume Picks up in Fox Factory.
- A Classic Breakout and Throwback (SCWX).
- ChartList Updates.
 ... Resistance in an Uptrend?
... The S&P 500 advanced to the resistance level heard round the world and backed off with a small decline the last few days, and I do mean small. As with the prior two resistance levels, resistance in the 2800 area is all over the financial news and every chart reader can see it. I discussed these three levels in Tuesday's commentary and show (On Trend on Youtube).
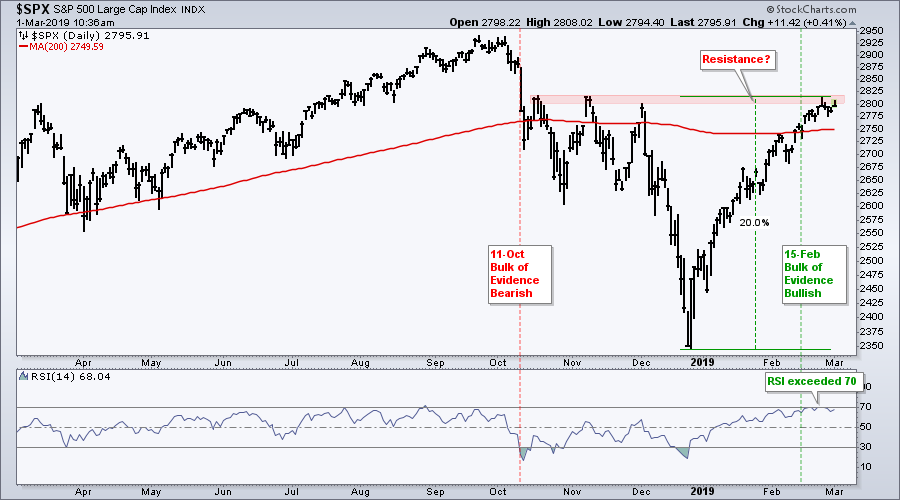
Even though I marked it in red, this is not really a robust resistance level, in my humble opinion. There is no such thing as a robust resistance level when the bigger trend is up. The bulk of the evidence turned bullish in mid February and this means the path of least resistance is up. Resistance levels in uptrends are not expected to hold because higher highs are the order of the day in uptrends.
I will, however, admit that the index was up 20% in forty days and ripe for a corrective period. And, RSI exceeded 70 for the first time since late August and became overbought. Note, however, that the S&P 500 continued to a higher high in September and a small bearish failure swing coincided with the September high.
Should the index break above the November-December high, the September high will become the next resistance level that EVERYONE is talking about. Personally, I think there is an inverse correlation between importance and media coverage. Don't expect Mr. Market to let the majority be correct!
Bulk of the Evidence Bullish
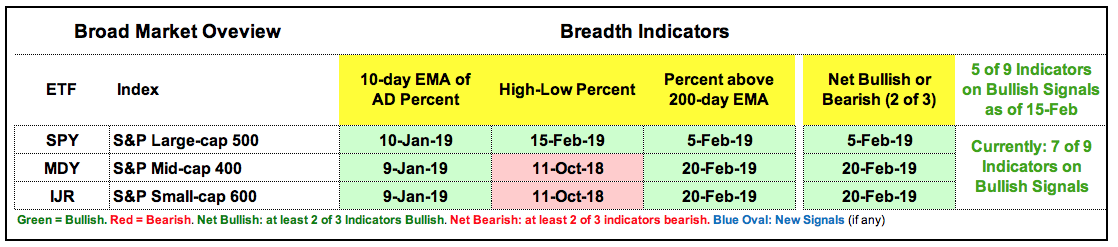
Five of the nine breadth indicators turned bullish on February 15th and this reversed the bearish signal from October 11th. Currently, seven of the nine breadth indicators are bullish. We are still waiting on S&P 400 High-Low% ($MIDHLP) and S&P 600 High-Low% ($SMLHLP) to exceed +10%.
The sector table turned "net bullish" on February 1st when the total bullish weightings exceeded 50%. Currently, ten of the eleven sectors are net bullish. Energy is the only bearish sector with two of the three indicators still on bearish signals. Communication Services, Consumer Staples and Finance are lagging in the new high category because their High-Low Percent indicators are still on bearish signals. Note that the index and sector table were updated last week.
Utilities, REITs and Industrials Lead in Price
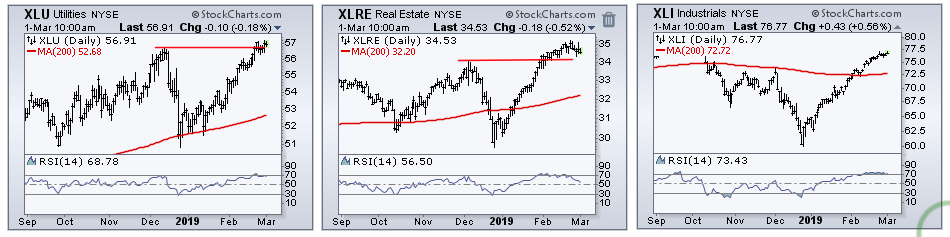
The Utilities SPDR is the top performing sector right now, in both price and breadth. On a total return basis, XLU hit a new high in late February. The only other sector close to a new high is the Real Estate SPDR, which is around 1.5% from a new high. The Industrials SPDR and Health Care SPDR are 4-5% from 52-week highs, while the Technology SPDR is around 7% from a 52-week high and the Financials SPDR is 10% from a new high.
Tech Leads in Uptrends and New Highs
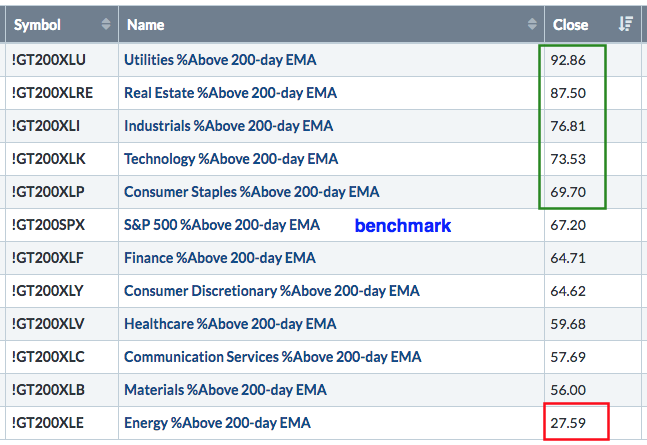
The table below ranks the sectors by the percentage of stocks above the 200-day EMA. 67% of stocks in the S&P 500 are above their 200-day EMAs. Utilities, REITs, Industrials, Technology and Consumer Staples are leading with a highest percentage of stocks above the 200-day EMA. Energy is the weakest with less than 30% of stocks above the 200-day EMA.
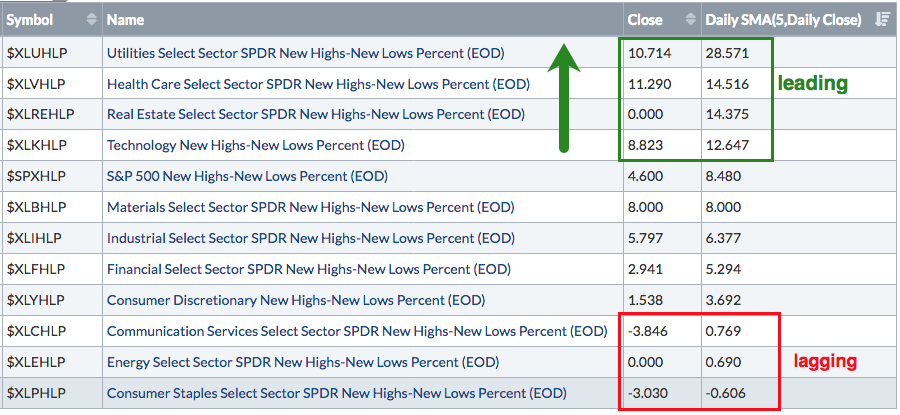
The next table shows the eleven sectors and the S&P 500 ranked by the 5-day SMA of High-Low Percent. Utilities, REITs, Healthcare, and Technology are leading this group with values above +10%. These are the sectors with the most new highs and strong uptrends. At the bottom, notice that Communication Services and Energy are barely positive, while Consumer Staples is negative. These sectors are NOT producing new highs and do not offer opportunity as far as I am concerned.
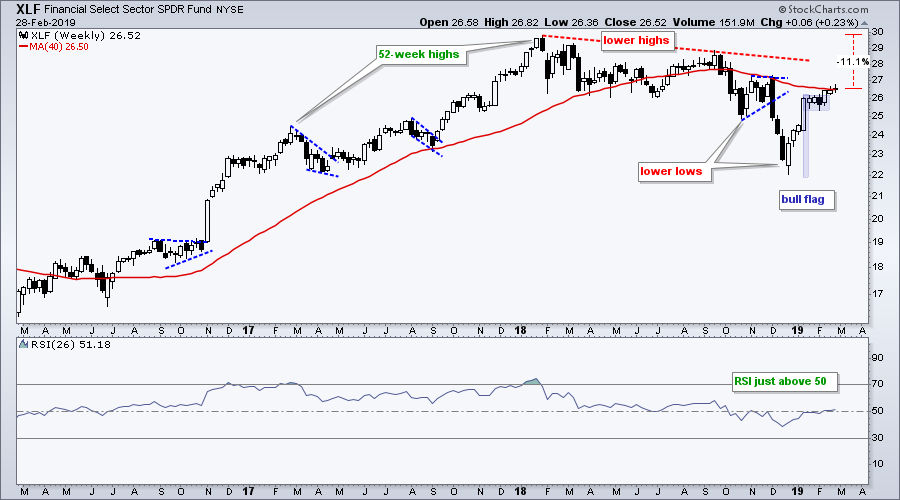
Finance Holds Flag Breakout
The Financials SPDR is holding the flag breakout with small gains over the last two weeks, In fact, XLF edged above its 40-week SMA this week. Even though XLF is not a leading sector, performance is perking up and the cup is half full right now.
When Bad News Could be Good (SQ)
Even though news is anathema to technical analysts, we can sometimes use the news in the analysis process. There are always two events: the news and the reaction to the news. Generally speaking, an advance in the face of seemingly bad news is positive, while a decline in the face of seemingly good news is negative.
Square (SQ), a leader in payment processing, fell after issuing disappointing guidance. The stock fell around 6% in the first 15 minutes of trading and then closed 2% higher on the day. Also note that SQ fell sharply on January 31st when it was downgraded, but then went on to consolidate and break pennant resistance on February 11th. Square moved higher after bad news on two occasions and this is positive.
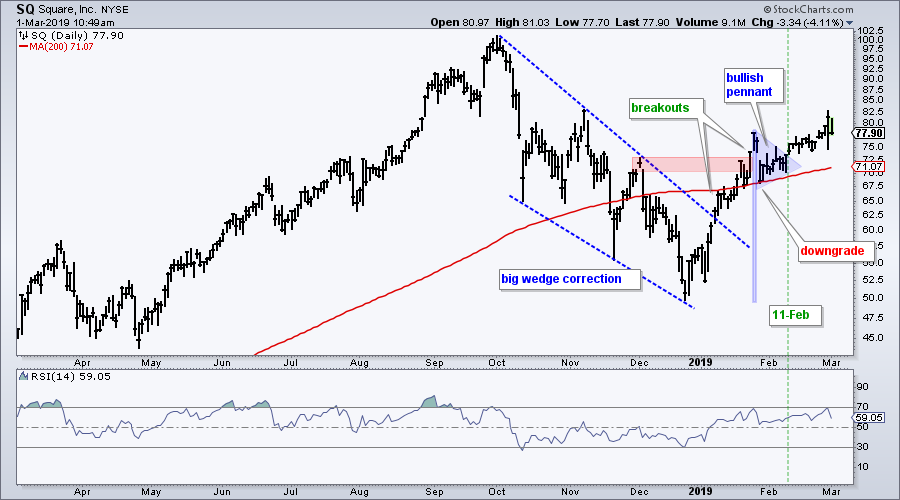
The price action remains bullish for Square as it builds on its pennant breakout and remains above its rising 200-day SMA. Looking at the bigger picture, the stock broke out of a large falling wedge in January and this signals a continuation of the prior advance. I will keep SQ on my radar for bullish setups in the future.
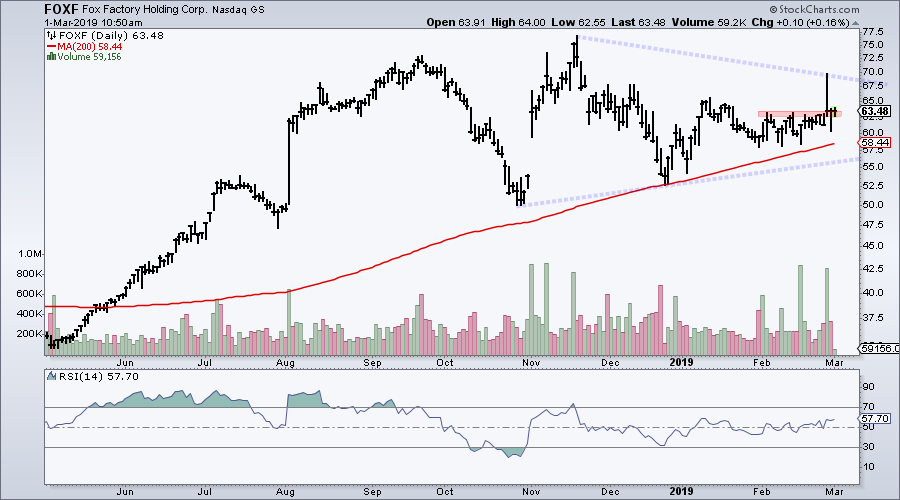
Volume Picks up in Fox Factory
Fox Factory (FOXT) makes high-performance suspension parts for bikes and off-road vehicles. It is part of the SmallCap Consumer Discretionary ETF (PSCD). The chart shows FOXF with a plunge in October and then higher lows in December and this year. Overall, I view the consolidation since October (blue lines) as a big bullish continuation pattern. More recently, the stock is just above the rising 200-day SMA and starting to show signs of strong buying pressure. Notice the three big volume spikes this month. I am going to add FOXF to the Art's Charts ChartList with a re-evaluation on a close below 60.
A Classic Breakout and Throwback (SCWX)
Secure Networks (SCWX) is in the cyber security space and the company is a spinoff from Dell Technologies (DELL). Yeah, that Dell. The chart sports a classic setup with the high volume breakout, throwback to the breakout zone and wedge breakout this week. The breakout held as the stock successfully bounced after the throwback. Keep this breakout-throwback sequence in mind when analyzing charts because it is one of my favorite setups. I will add SCWX to the Art's Charts ChartList today.
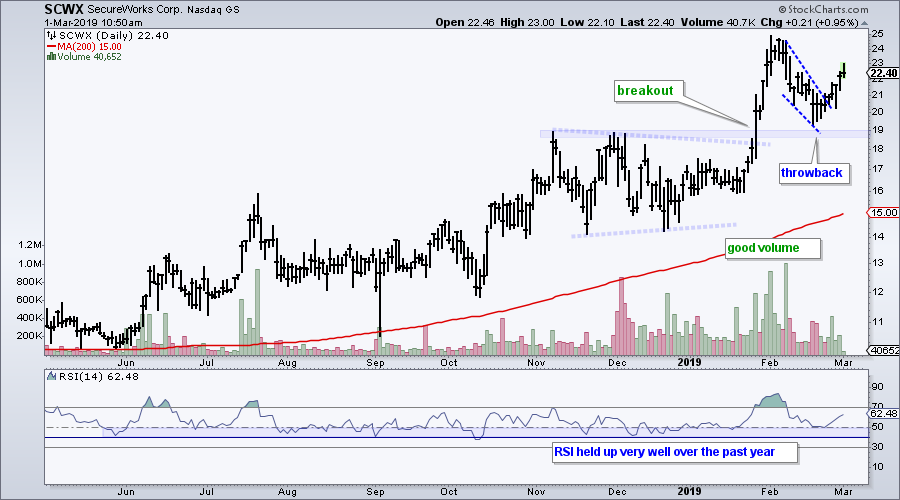
The indicator window shows RSI dipping below 40 for a few days in October, but holding above this level for most of the past year. The ability of RSI to hold the 40 area shows limited downside momentum on the dip. In addition to limited downside, we are also seeing strong momentum because RSI moved well above 70 earlier this year. Thus, SCWX has a consistent up trend with strong momentum.
ChartList Updates
The Art's Charts ChartList focuses on stocks and ETFs with uptrends and good momentum. Several international ETFs were added in December, but I will be looking to replace these with stocks now that the broader market environment looks better. Many of these stocks are growth-momentum names, which means risk is above average. I take a portfolio approach (20-30 positions) to spread risk and keep position sizes relatively small (3-5%). I do not know which picks will work and which will fail. There will be failures and successes as well as slumps and streaks. Hopefully, when measured on a monthly or quarterly basis, the successes will outpace the failures and the net will be positive.
Recent Changes:
190301 - FOXF and SWCX added.
190301 - WBA, EXPE and PHM remove. WBA broke support and the 200-day on Friday. EXPE fell sharply and it does not look like support will hold. PHM is not acting well and below 200-day SMA.
190301 - AMD. Watch closely because a bearish wedge could be forming.
190227 - VRTX added (commentary link)
190226 - AVGO, VMW, CYBR, FIVN, PFPT, QLYS, ZS removed (commentary link)
Click here for the Art's Charts ChartList
Questions, Comments or Feedback?
I do not take symbol request and I cannot promise to response to all correspondence, but I will read it and take into under consideration. I greatly appreciate all feedback because it helps me improve the commentary and provides ideas for the future.

Plan Your Trade and Trade Your Plan.
- Arthur Hill, CMT
Senior Technical Analyst, StockCharts.com
Book: Define the Trend and Trade the Trend
Twitter: Follow @ArthurHill


