 Apple, Amazon and Alphabet account for around 9 percent of the S&P 500 SPDR and around 27 percent of the Nasdaq 100 ETF. Thus, the next directional move in these three will clearly impact the broader market. As the charts now stand, Apple, Amazon and Alphabet are lagging many of their peers because they are below their 200-day SMA. In contrast, Intel, Microsoft and Cisco are above their 200-day SMA and up more year-to-date.
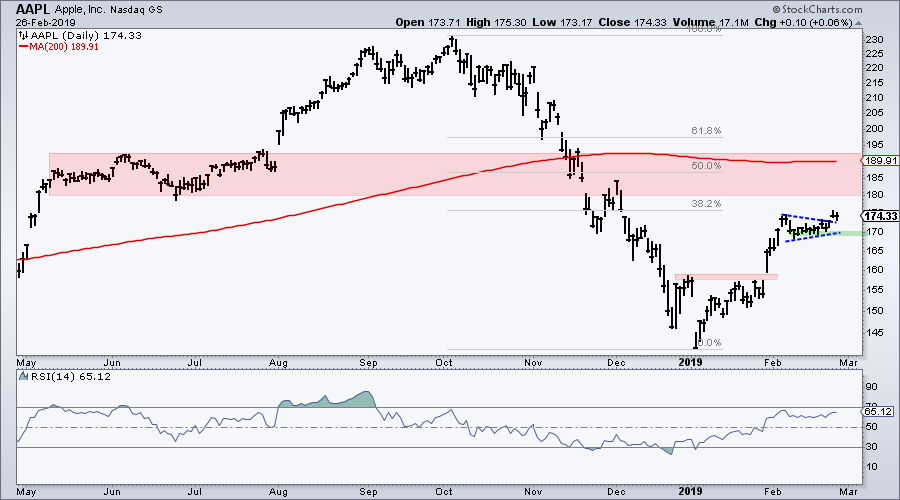
The first chart shows Apple with a surge in January, a tight consolidation in early February and a breakout two days ago. Notice that Apple broke out with a small gap and this gap is largely holding. Mind the gap because it is bullish as long as it holds. This breakout could extend to the 200-day SMA in the 190 area. The February lows mark consolidation support and this is the first level to watch for reversal of the short-term uptrend.
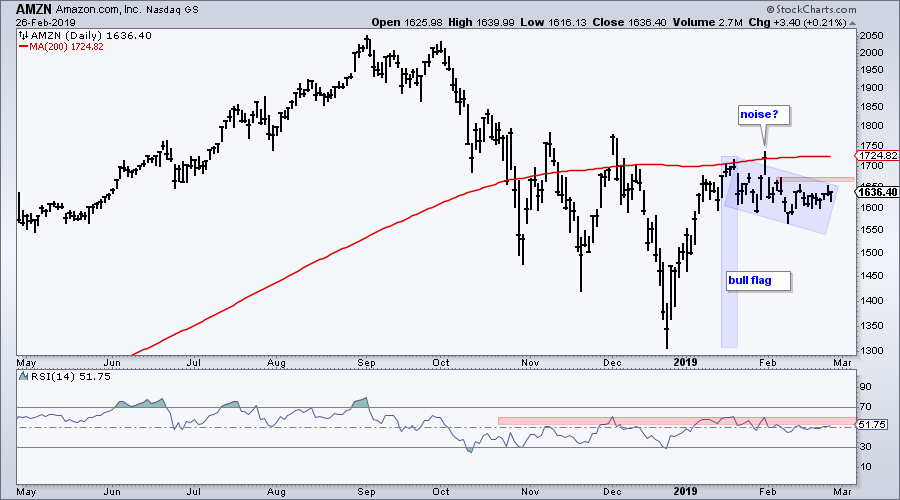
The next chart shows Amazon with a surge to the 200-day SMA in mid January and a pullback into February. Ignoring the spike on January 31st (noise), the pattern could be a bull flag. We basically have a surge and a consolidation with a downward drift. A breakout at 1675 would signal a continuation higher and be bullish.
The third chart shows Alphabet with a surge and break above the early December high. The breakout did not hold, but it also did not exactly fold as the stock simply consolidated with a pennant. Pennants are short-term bullish continuation patterns and a breakout at 1140 would be bullish.
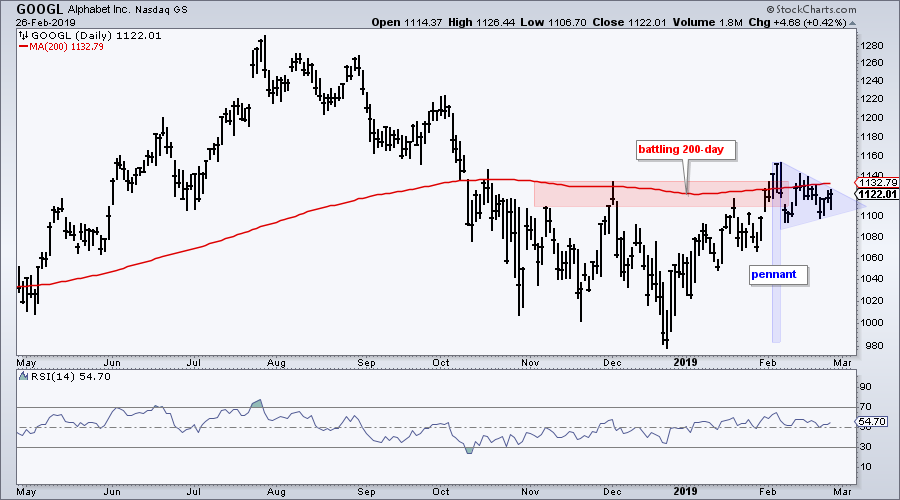
Apple has a breakout working, while Amazon and Alphabet are short of breakouts. Breakouts from the latter two would be quite positive for QQQ and the broader market. The green zones on each chart mark support levels based on closing prices. A close below these support levels would be negative.
ChartList Update
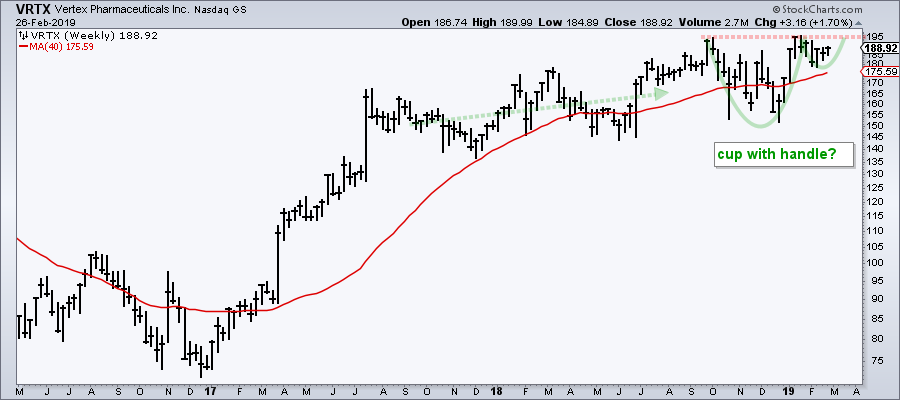
I am adding Vertex (VRTX) to the Art's Charts Chartlist. This stock was profiled in DITC on Monday with bullish patterns on two timeframes. A cup-with-handle is forming on the weekly chart and the handle looks like a bull flag on the daily chart.
On Trend on YouTube
Potential Resistance versus Existing Uptrend
- Third Time Lucky for Resistance?
- Breadth/Trend Indicators Remain Strong
- Breaking Down the SPY and QQQ (top stocks)
- Bond ETFs are Winding Up (Bollinger Bands)
- XLC and XLE are the Lagging Sectors
- Tesla Seriously Underperforming Auto Group
- Click here to Watch
- Arthur Hill, CMT
Senior Technical Analyst, StockCharts.com
Book: Define the Trend and Trade the Trend
Twitter: Follow @ArthurHill


