Triple 90% Down Day
It is way too early to call for a major top, but we do have a short-term breadth signal that points to further downside. The chart below shows AD Percent for the S&P 500, S&P Mid-Cap 400 and S&P Small-Cap 600. Together, these three indexes form the S&P 1500 and represent an excellent cross-section for the stock market. In addition to including small-caps, mid-caps and large-caps, the S&P 1500 also includes stocks from the NYSE (920) and Nasdaq (580). Breadth indicators based solely on NYSE or Nasdaq stocks are incomplete and not representative of the market as a whole.
AD Percent equals net advances divided by total issues ((advances - declines)/total issues)). A move above +80% in AD Percent means more than 90% of stocks in the index advanced on that particular day, while a move below -80% means more than 90% of stocks declined. Using SPX as an example: 50 advances less 450 declines equals -400 net advances and -400 divided by 500 = -80%. It is a breadth indicator used to measure a daily breadth thrust, both up and down. The red lines show when all three AD Percent indicators moved below -80% on the same day and the green lines show when all three moved above +80%.
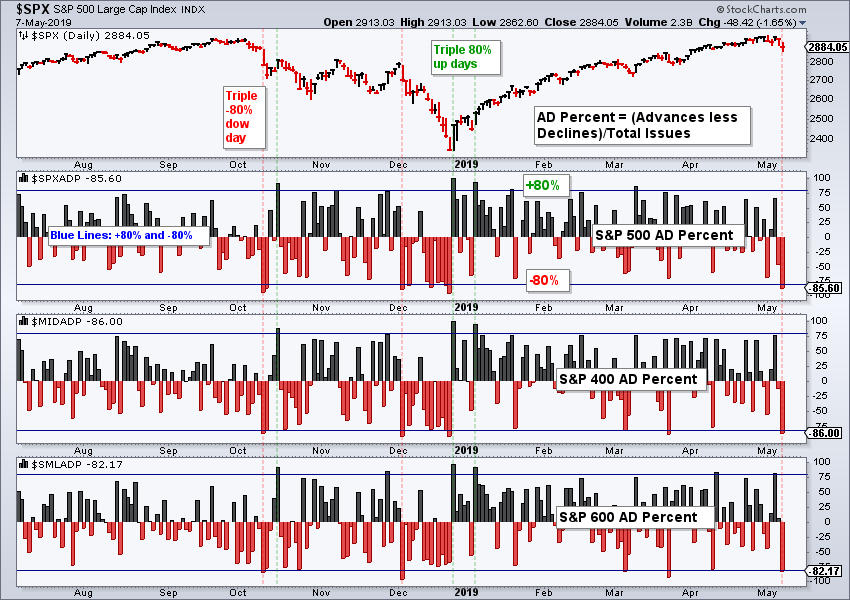
Looking at recent signals, there was a whipsaw in October, but the Triple 90% Down Day in early December was timely. In addition, the Triple 90% Up Days in late December and early January were timely. All three moved below -90% on Tuesday and this is the first warning sign for the bulls. The Triple 90% Down Day shows broad selling pressure that could extend in the coming days or weeks.
Bullish and Bearish Breadth Thrusts
I also use the 10-day EMA of AD Percent to measure bullish and bearish breadth thrusts. This indicator covers a more medium-term timeframe and is similar to the Zweig Breadth Thrust. The 10-day EMA of AD Percent last triggered bullish on January 10th when all three surged above +30%. This shows broad upside participation in the S&P 500, S&P Mid-Cap 400 and S&P Small-Cap 600 over a 10 day period. This indicator group triggers net bullish or bearish when at least two of the three breach their bullish/bearish thresholds (+30%/-30%).
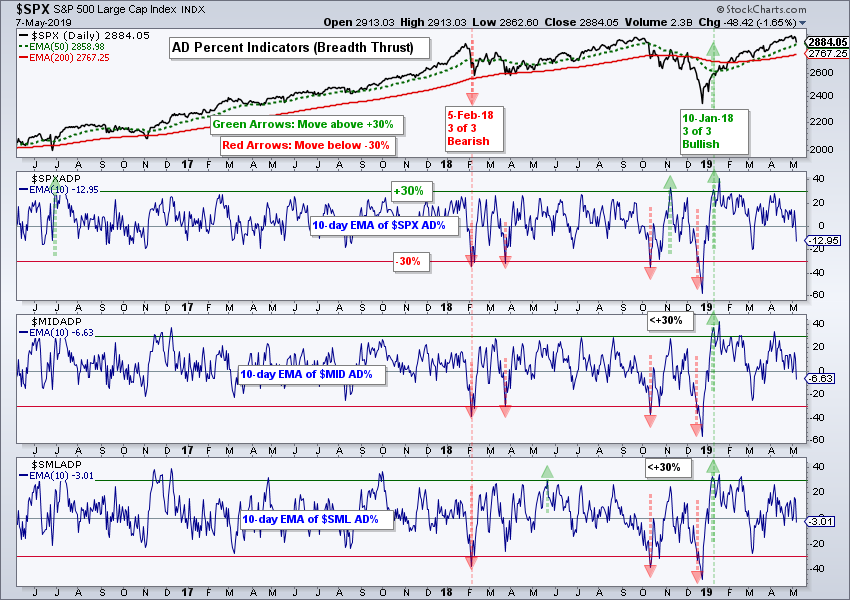
As you can see, there is usually a pecking order for bearish signals. The daily AD Percent indicator is often first to trigger and its signals are not always confirmed by the 10-day EMA of AD Percent. At this point, I view the Triple 90% Down Day as a short-term bearish signal that could give way to a 5-6% pullback in the $SPX. Subsequent signals from the 10-day EMA of AD Percent would suggest an even deeper and more extended decline. It has not happened yet, but this is what to watch for next.
High-Low Line is Next in Line
The High-Low Line is the next indicator in the pecking order. New highs and new lows are lagging indicators. New highs typically do not expand until after an extended or sharp advance, while new lows do not expand until after an extended or sharp decline. The High-Low Line is a cumulative measure of High-Low Percent ((new highs - new lows)/total issues). The chart below shows the High-Low Lines plunging in December, flattening and then turning up in late January. Notice how they turned up a month after the market bottomed.
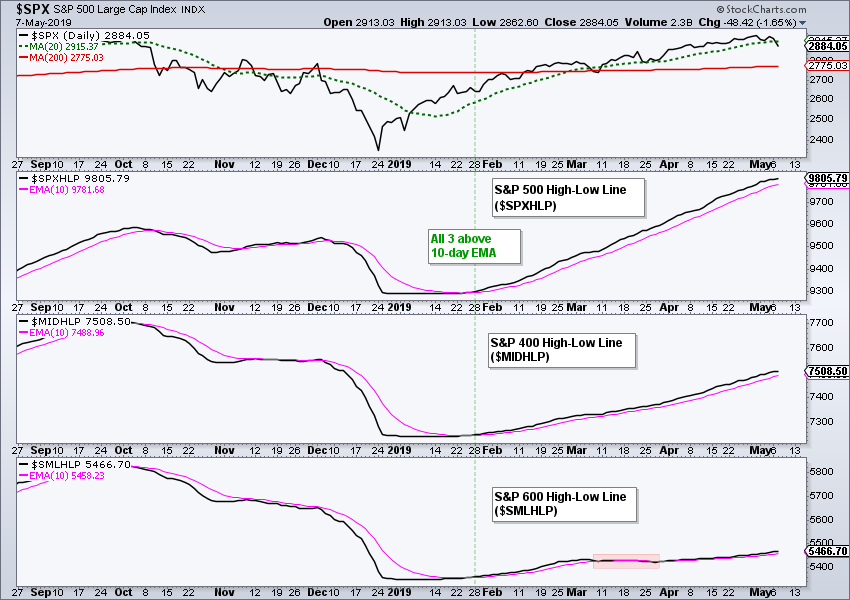
All three High-Low Lines crossed above their 10-day EMAs in late January to signal that new highs were outpacing new lows. The S&P 500 and S&P Mid-Cap 400 High-Low Lines rose steadily the last 4+ months, but the S&P Small-Cap 600 High-Low Line took a dip in March. All three are currently above their 10-day EMAs. A move below these 10-day EMAs in two of the three would be bearish.
On Trend on Youtube (Tuesday, 7-May)
- Broadening Formation versus Uptrend
- S&P 500 is Ripe for Correction
- Russell 2000 ETF Breaks Out
- Healthcare and Biotech Buck the Selling
- Cyber Security ETF Works its Way Higher
- Stocks: PANW, PFPT, SCWX and ON
- Click here to Watch https://youtu.be/vxSlv4uvCEo
Arthur Hill, CMT
Senior Technical Analyst, StockCharts.com
Author, Define the Trend and Trade the Trend
Want to stay up to date with the latest market insights from Arthur?
– Follow @ArthurHill on Twitter
– Subscribe to Art's Charts
– Watch On Trend on StockCharts TV (Tuesdays / Thursdays at 10:30am ET)


