- Walking Down the Lower Band.
- Swings are Getting Bigger.
- Selling Pressure Expands to Defensive Sectors.
- Bearish Breadth Thrust for XLP and XLV.
- On Trend on Youtube.
...Walking Down the Lower Band
...Even though the weight of the evidence has yet to turn bearish for the S&P 500, the short-term trend is clearly down as SPY hugs the lower Bollinger Band. Note that the weight of the evidence is updated every Friday in the Weekly Market Review and Outlook. A few more down days this week and we could see a shift in the indicator table so stay tuned. Note that the S&P 500 accounts for some 80% of the US equity market and we cannot have a bear market without participation from the 800 pound gorilla.
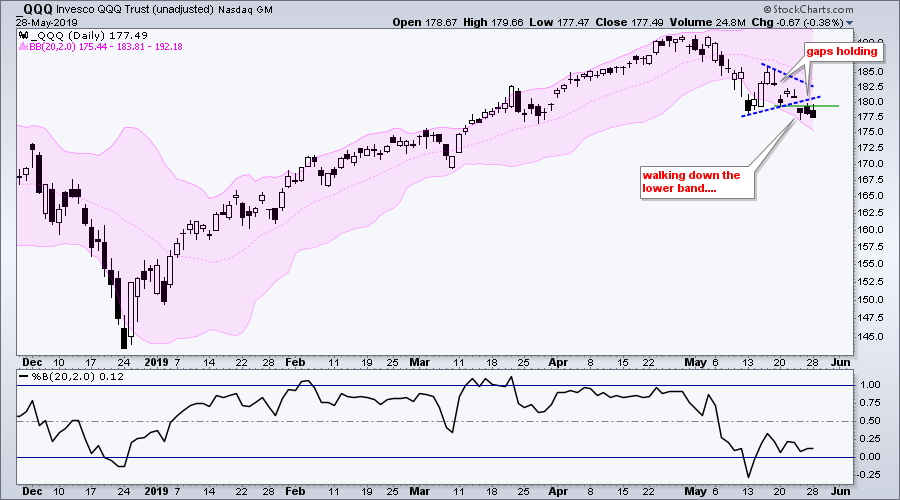
The short-term downtrend extended with pennant breaks last Friday. The SPY chart shows the ETF breaking below the 50-day SMA in mid-May, stalling as a pennant formed and breaking the pennant line with a gap on Friday. This signals a continuation lower and targets a move to the 272 area. The prior decline was from ~295 to ~280 (~15 points) and the current decline started from the 287 area (287 - 15 = 272). Take targets with a bucket of salt because they are only valid as long as the short-term downtrend holds.
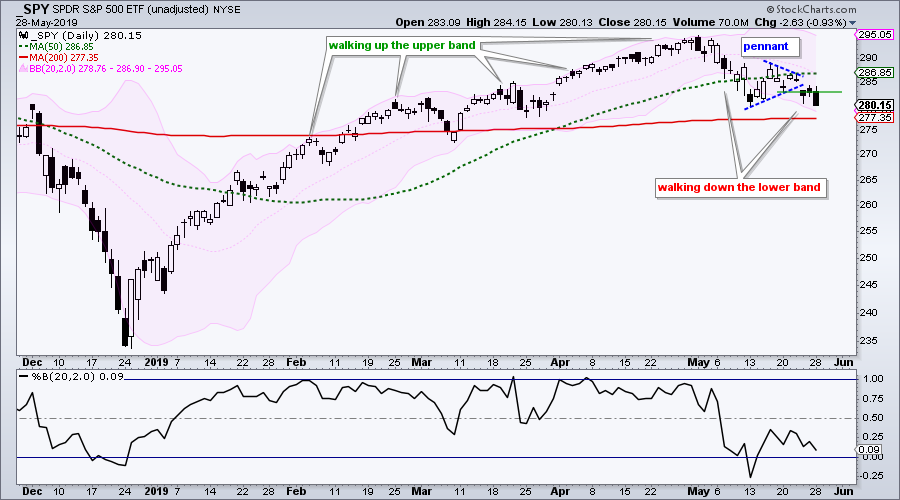
This chart also shows the Bollinger Bands in pink and %B in the indicator window. %B moves above 1 when price exceeds the upper band and below 0 when price exceeds the lower band. Notice how prices hugged the upper band from early February to early May and %B reached the 1 area several times. This is what John Bollinger described as "walking up the band" and this occurs in strong uptrends. Well, it looks like the opposite is occurring right now as price moved below the lower band in early May and %B is close to 0 now (.09). Price could be preparing to walk down the lower band.
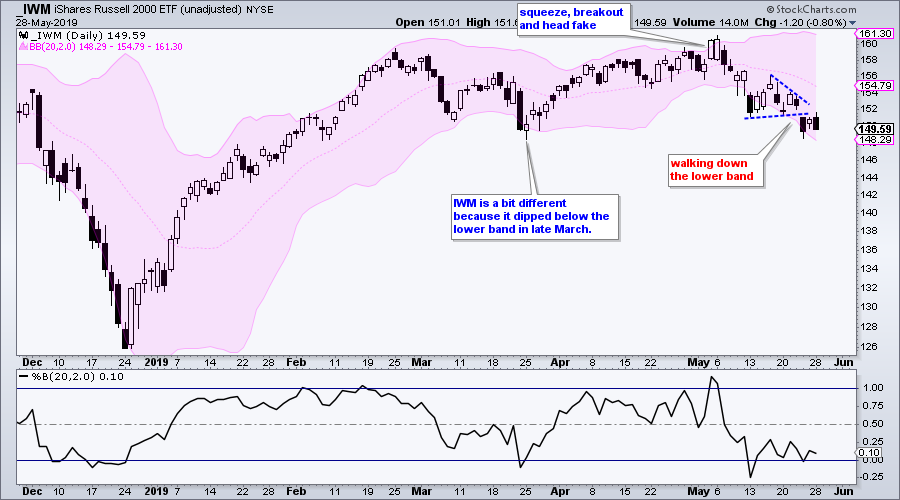
The IWM chart is a bit different than SPY and QQQ. IWM dipped below the lower band in late March and failed to hold a breakout in early May. Notice that the Bollinger Band narrowed before this breakout. John Bollinger referred to this squeeze, breakout and failure sequence as a "head fake". This occurs when price breaks out of a Bollinger Band squeeze, but the initial break does not hold and prices reverse course. IWM subsequently exceeded the lower band and broke the pennant line with a gap.
Swings are Getting Bigger
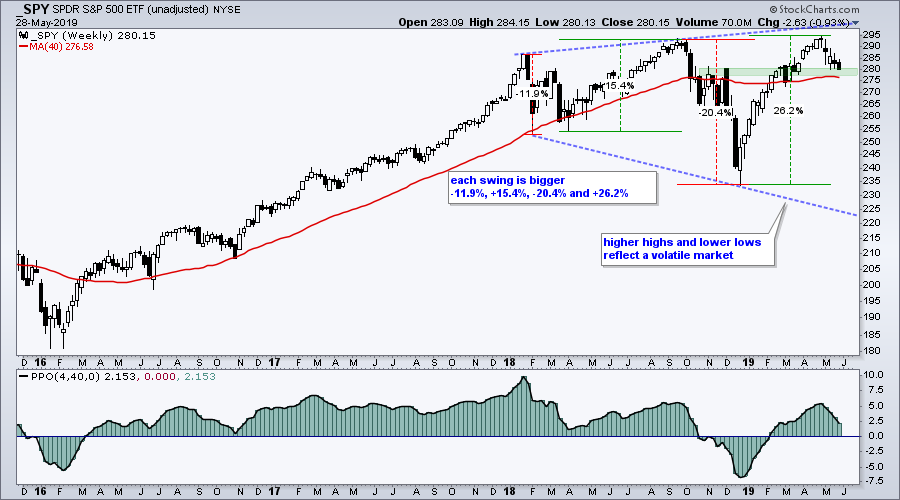
Even though the weight of the evidence remains bullish for the S&P 500, the swings are getting bigger and I would not take a bearish signal lightly at this stage. Also keep in mind that we are entering the worst four month stretch for stocks. The weekly chart shows SPY with higher highs in September and April, and a lower low in December (52-week low). Each swing as become progressively bigger. Even though this does not guarantee a bigger downswing in the future, it does reflect a volatile market with above average risk and uncertainty. SPY is currently above the 40-week SMA and above the support zone from broken resistance. A breakdown here could set the stage for a treacherous 3-4 month stretch. This might be a good time to build that deck, practice your tennis backhand or go fishing.
Selling Pressure Expands to Defensive Sectors
The table below shows the percentage change for the intermarket names and the 11 sector SPDRs. The US Dollar ETF (UUP) and 20+ YR T-Bond ETF (TLT) gained as SPY fell. Also note that the EW S&P 500 ETF (RSP) was down more than SPY. This means the average stock in the S&P 500 suffered more than the large-cap stocks.
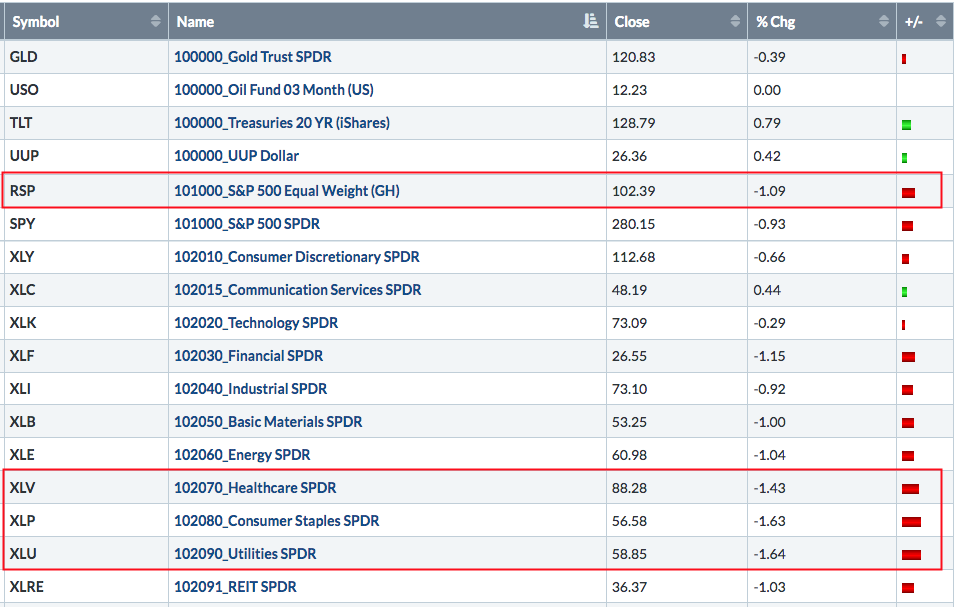
We also saw the defensive sectors come under pressure with the Health Care SPDR (XLV), Utilities SPDR (XLU) and Consumer Staples SPDR (XLP) declining the most on Tuesday. Even though Staples and Utilities are still leading overall, it is important to remember that they may not be immune to weakness should the weight of the evidence turn bearish.
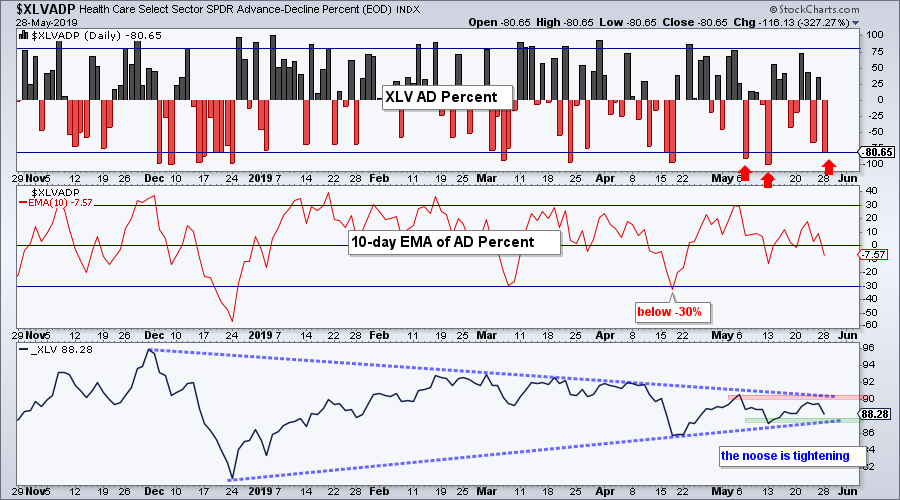
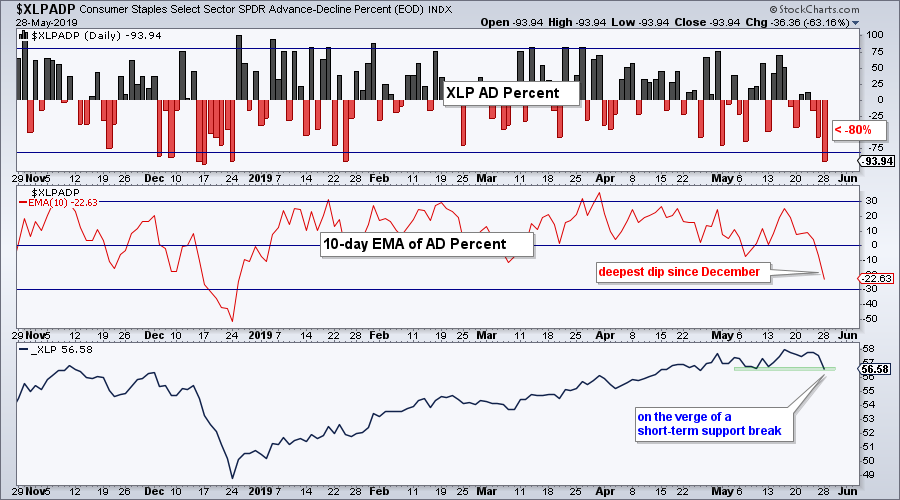
Bearish Breadth Thrust for XLP and XLV
The next charts show AD Percent in the top window, the 10-day EMA of AD Percent in the middle window and price in the lower window. HealthCare AD Percent ($XLVADP) dipped below -80% three times this month and did not exceed +80%. The three dips below -80% show strong downside participation and the failure to exceed +80% shows limited upside participation. The 10-day EMA of AD Percent, which is more of a medium-term indicator, dipped below -30% on April 17th and has yet to exceed +30%. I wrote positive on XLV on Friday, but a bullish breadth thrust and breakout from the large symmetrical triangle are needed to turn bullish on the sector.
The next chart shows Staples AD Percent ($XLPADP) dipping below -80% for the first time since December. This shows the most downside participation of the year and represents a short-term bearish breadth thrust. The 10-day EMA of AD Percent moved to its lowest level since December, but has yet to trigger a medium-term breadth thrust (< -30%).
On Trend on Youtube (Tuesday, 28-May)
- Walking Down the Lower Bollinger Band
- Sectors Above/Below 200-Day SMA
- Focus on XLV and Healthcare Stocks
- Breakdowns in Industrial and Discretionary Stocks
- FAAAM+: FB, AMZN, AAPL, GOOGL, MSFT (+NFLX).
- Click here to Watch
Arthur Hill, CMT
Senior Technical Analyst, StockCharts.com
Author, Define the Trend and Trade the Trend
Want to stay up to date with the latest market insights from Arthur?
– Follow @ArthurHill on Twitter
– Subscribe to Art's Charts
– Watch On Trend on StockCharts TV (Tuesdays / Thursdays at 10:30am ET)


