- Key Moving Average Turns Lower.
- Mid-caps Trigger Bearish Breadth Signal.
- Small-caps Lead New Low Expansion.
- Four New Signals on Sector Table.
- Risk Aversion Indicators Surge.
- Treasury Bonds Extend Surge.
- Consumer Discretionary Sector Breaks Down.
- Oil Extends Decline.
- Gold Forms a Bull Wedge.
- Art's Charts ChartList Update.
 ... Stocks are short-term oversold as the S&P 500 flirts with its 200-day SMA. Even though the odds for a short-term bounce are increasing, the longer-term bearish evidence is stacking up. In fact, another strong decline could flip the breadth tables from bullish to bearish. The S&P Small-Cap 600 has been net bearish since March and the S&P Mid-Cap 400 flipped to net bearish this week. The S&P 500 remains the hold out, but we also saw deterioration in the sector table this week. Oil and the consumer discretionary sector also broke down recently and we are seeing an increase in risk aversion in some key ratio charts.
Key Moving Average Turns Lower
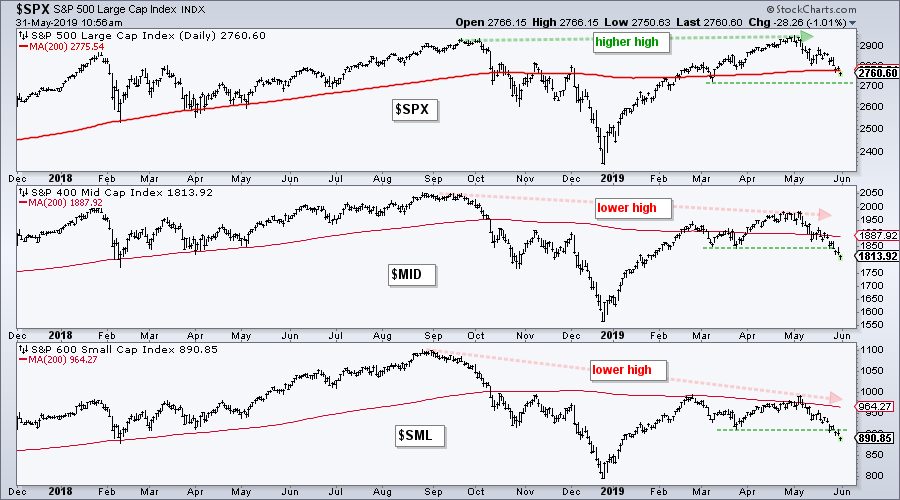
The S&P 500 hit a new high in early May, but the S&P Small-Cap 600 and S&P Mid-Cap 400 fell well short of their 2018 highs. All three indexes fell in May with small-caps and mid-caps leading the way lower. $SML and $MID are down around 7% month-to-date, while $SPX is down around 5.3%.
We can also see relative weakness by comparing corresponding peaks and troughs, as well as prices and their 200-day SMAs. In addition to lower highs over the last nine months, $SML and $MID are below their 200-day SMAs. The S&P 500 is currently trading near its 200-day SMA and holding up better. $SPX is also above its March low, whereas $SML and $MID broke these lows this week.
 The next chart removes price by selecting "Invisible" for chart "Type" ($SPX) and "Style" ($MID and $SML). Chartists can focus on the direction of the moving average by removing price. The 200-day for $MID peaked in October and the 200-day for $SML peaked in December. Meanwhile, the 200-day for $SPX hit a new high in May.
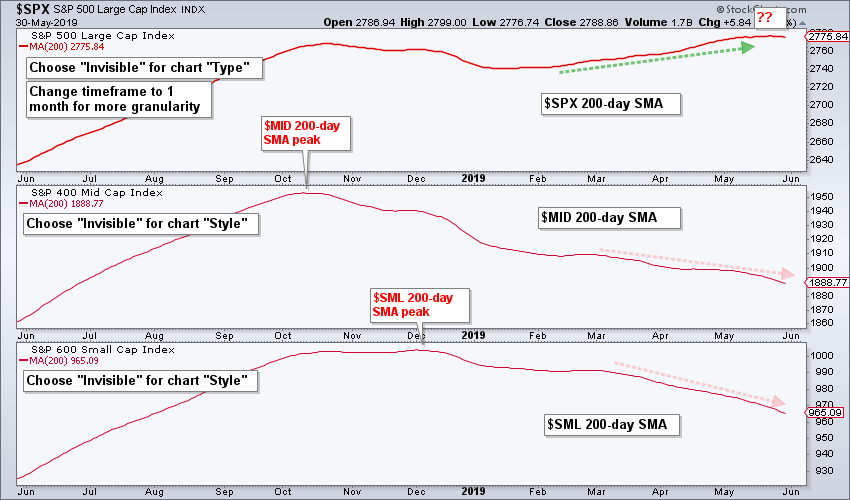
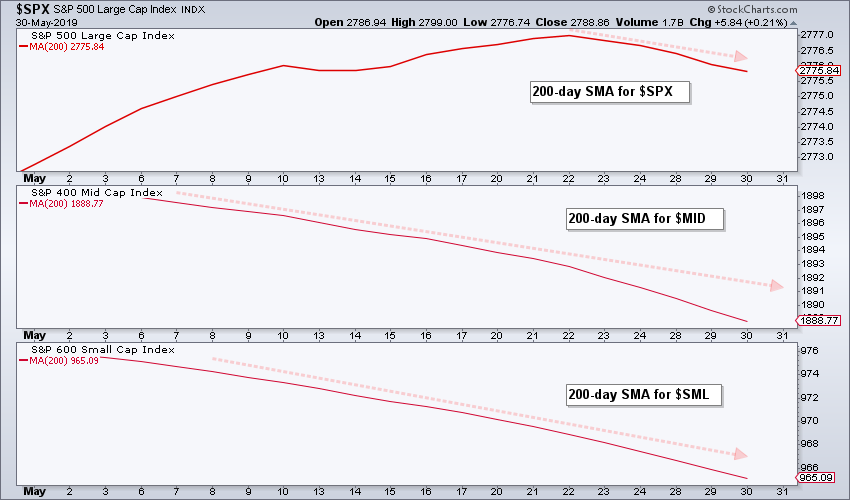
More recently, the 200-day SMAs have been falling for $SML and $MID since March, while the 200-day for $SPX turned down over the past week. Needless to say, a downturn in the 200-day SMA for the S&P 500 would reflect a longer-term downtrend and this would be quite negative for the broader market. The last chart shows these SMAs over the past month and we can see the 200-day turning down for $SPX.
Mid-caps Trigger Bearish Breadth Signal
There was one new signal in the index breadth table as Mid-Cap %Above 200-day EMA (!GT200MID) moved below 40% on May 29th. This means two of the three indicators are now on active bearish signals for the S&P Mid-Cap 400 and S&P Small-Cap 600. All three indicators remain on active bullish signals for the S&P 500, which means the overall table is still net bullish (5 of 9 bullish signals or 4 of 9 bearish signals).
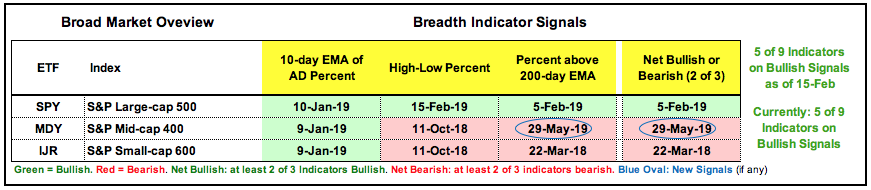
Keep in mind that the S&P 500 is the 800 pound gorilla in the room because it accounts for some 80% of the total US stock market. Thus, the bull market is not over until the 800 pound gorilla sings.
Small-caps Lead New Low Expansion
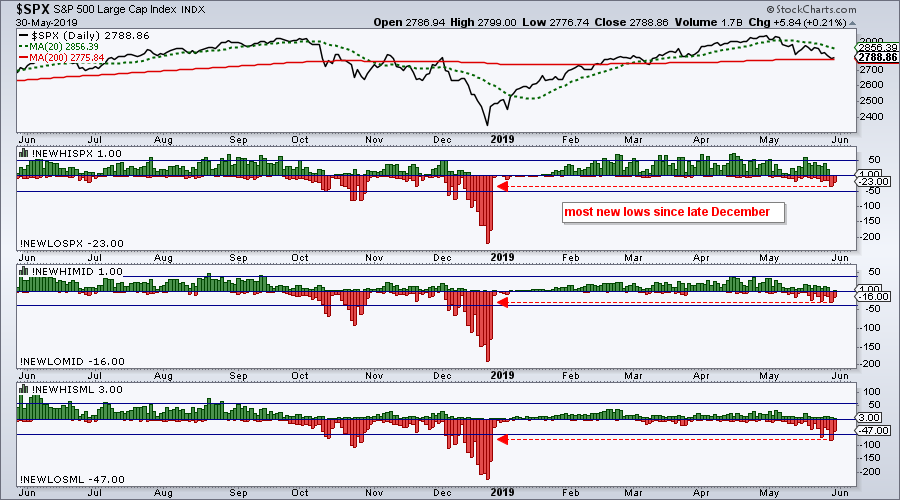
The next chart shows the high-low pairs for the S&P 500, S&P Mid-Cap 400 and S&P Small-Cap 600. The horizontal blue lines are set at 50/-50 for $SPX, 40/-40 for $MID and 60/-60 for $SML, which equates to 10%/-10% of total issues for each index. New Lows expanded this week and hit their highest level since December. Notice that S&P Small-Cap 600 New Lows (!NEWLOSML) exceeded -60 twice in the last five days. This means more than 10% of stocks in the index hit new lows and these stocks are in strong downtrends.
Four New Signals on Sector Table
Even though the S&P 500 remains net bullish, we can see some serious deterioration when looking at the sector breadth table. There were four new bearish signals and three sectors switched from net bullish to net bearish. The Communication Services SPDR (XLC), Consumer Discretionary SPDR (XLY) and Materials SPDR (XLB) are now net bearish because two of the three indicators are on active bearish signals.
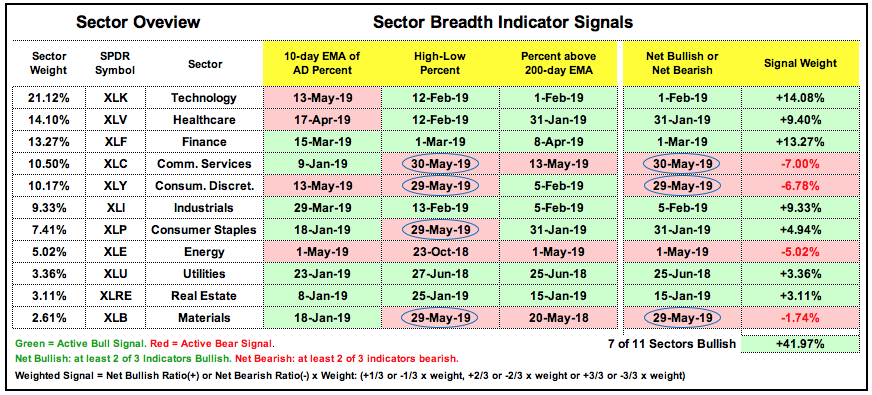
The signal weight total can range from -100% to +100% and now sits at +41.97%, which is still positive and still favoring the bulls. This positive total, however, has been cut in half over the last four weeks. Calculation note: the weight of the sector is multiplied by the indicator ratio to calculate the signal weigh for each sector (last column). XLC has one bullish signal and two bearish signals so the indicator ratio is -2/3. This is multiplied by the sector weight (10.50%) for a signal weight (10.50% x -2/3 = -7%). The signal weights are then added together for an overall score.
Sectors with Most New Lows
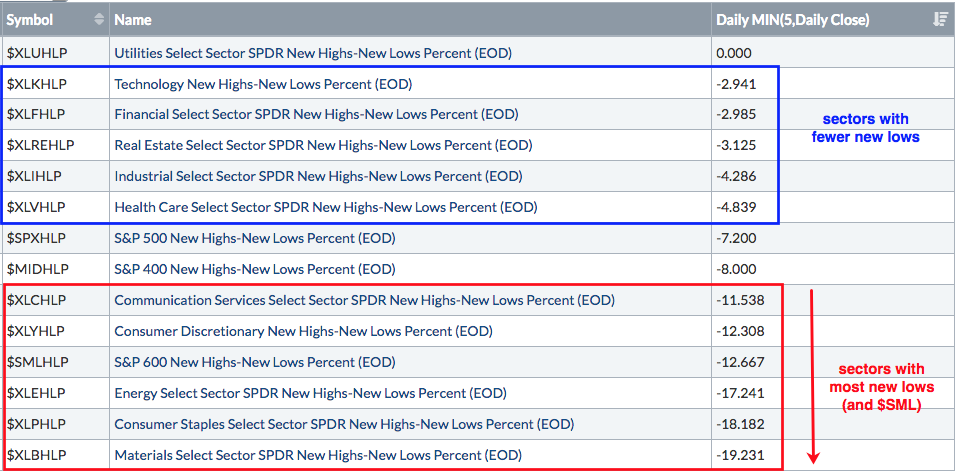
The table below shows the 5-day lowest low value of the High-Low Percent indicators for the eleven sectors and three indexes. As the red outline shows, High-Low Percent dipped below -10% for five sectors and the S&P Small-Cap 600. These are the weakest areas of the market. The blue outline shows the sectors with the fewest new lows, but High-Low Percent is still negative and this means new lows outpaced new highs in every sector but utilities.
Risk Aversion Indicators Surge
The yield spread between junk bonds and Treasuries surged to its highest level since early February. The yield spread broke above prior peaks from March and mid May as well. Bond investors are demanding more yield from junk bonds (relative to Treasuries) and this signals risk-aversion in the credit markets. The indicator window shows a strong negative correlation between this yield spread and the S&P 500. Thus, a breakout and rise in the yield spread is negative for stocks.
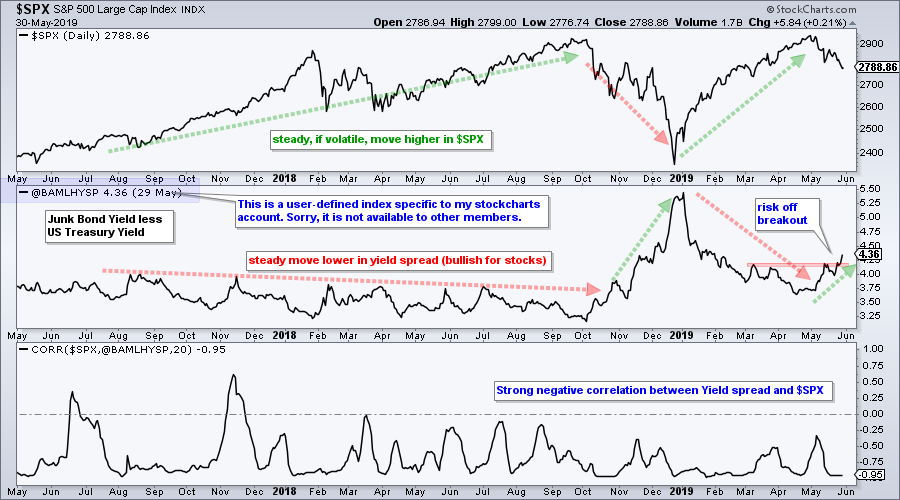
The symbol @BAMLHYSP is a user-defined index based on a data series from the St. Louis Fed database (FRED). StocksCharts members can chart user-defined indexes that they created, but these cannot be shared with other members (sorry). You can learn more about user-defined indexes in this support article and more about the data series at the St. Louis Fed site.
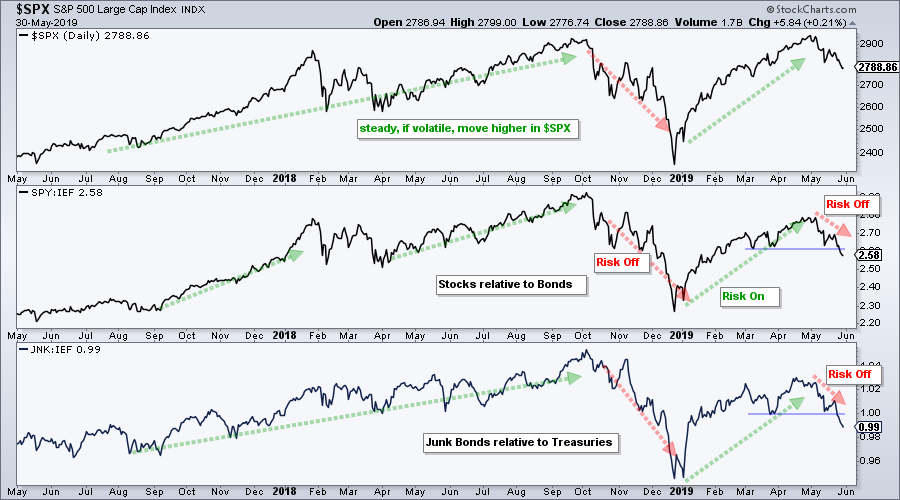
The next chart shows the stock/bond ratio (SPY:IEF) breaking below its March lows with a sharp downturn in May. This means stocks are UNDERperforming bonds and bonds are OUTperforming stocks. This is negative for stocks. The lower window shows the ratio of junk bonds to Treasuries (JNK:IEF) and it too is breaking below its March lows. The signals from the credit markets are negative.
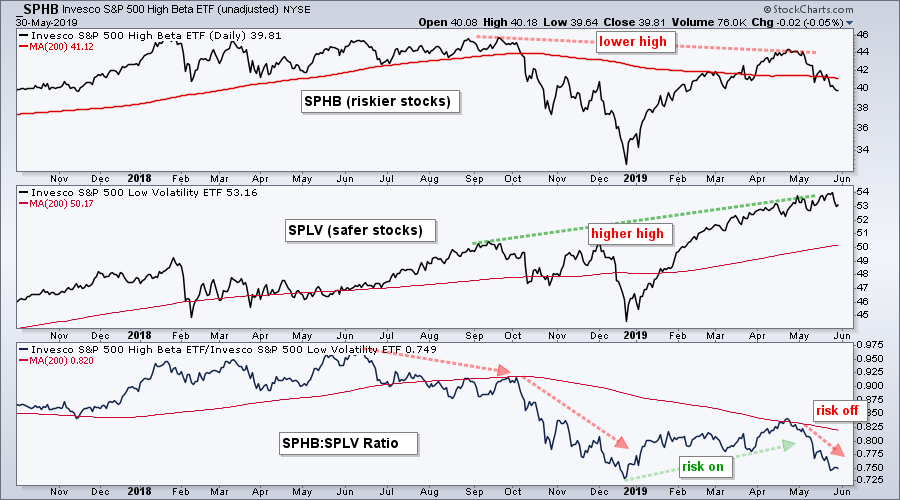
The final piece of the risk puzzle shows high beta stocks (SPHB) seriously underperforming low volatility stocks (SPLV). High beta stocks have higher volatility and more risk, while low volatility stocks have less risk. The SPHB:SPLV ratio rose from late December to late April as high beta stocks outperformed. This ratio took a nose dive in May as high beta stocks underperformed and this shows risk-aversion in the stock market.
Treasury Bonds Extend Surge
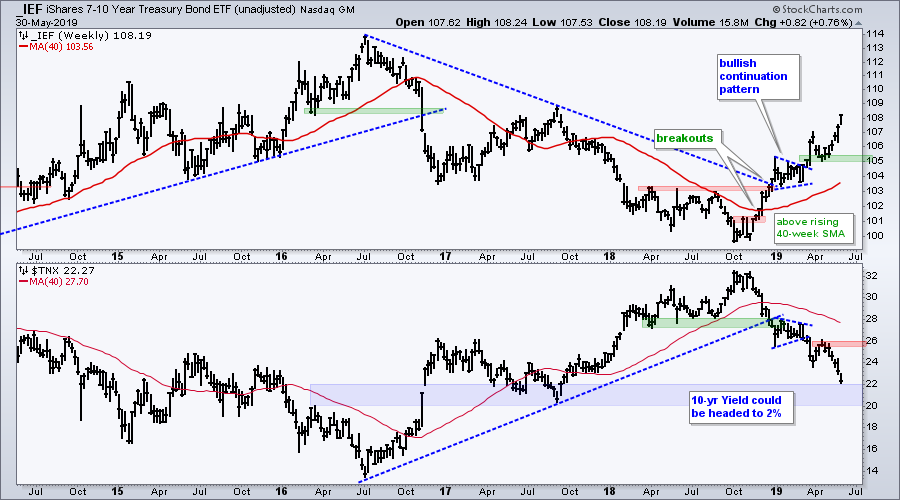
The 7-10 YR T-Bond ETF (IEF) surged again this week and is up four weeks straight, provided Thursday's gains hold. IEF is now up around 8% from its October lows and in a strong uptrend. The ETF is well above its rising 40-week SMA and first support is set at 105. The lower window shows the 10-yr T-Yield ($TNX) heading towards 2%. While I do not think the move is over, IEF is getting quite extended and ripe for a rest. Notice Bonds peaked when the 10-yield yield hit the 2-2.2% area in middle of 2017 (blue zone at 20-22 on the chart). This area could mark support for yields and resistance for IEF in the coming days/weeks.
Consumer Discretionary Sector Breaks Down
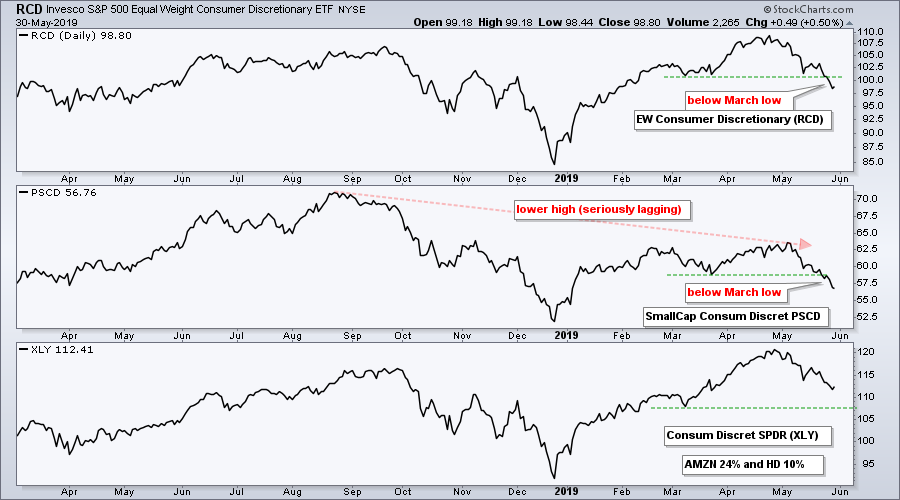
The next chart shows the EW Consumer Discretionary ETF (RCD), the SmallCap Consumer Discretionary ETF (PSCD) and the Consumer Discretionary SPDR (XLY). Note that XLY is dominated by Amazon (25%) and Home Depot (10%). XLY remains well above its March low, but RCD broke this low. This means the average stock in the consumer discretionary sector is under pressure. PSCD formed a lower high from August to May and broke the March low this month. Small-cap consumer discretionary stocks are seriously suffering. Weakness in the consumer discretionary sector is significant because its is the most economically sensitive sector.
Oil Extends Decline
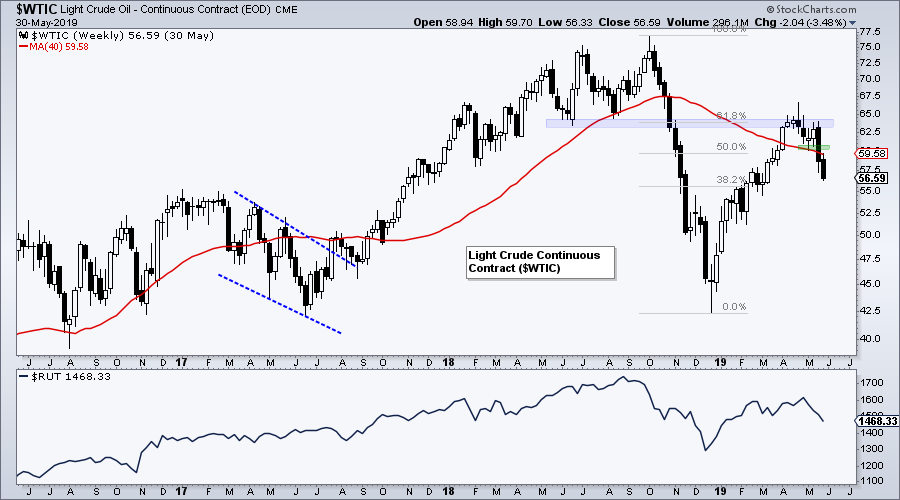
The Light Crude Continuous Contract ($WTIC) broke down last week and extended its decline this week. Notice how Light Crude met resistance near broken support and the 61.8% retracement. As with the Russell 2000, crude did not come close to its 2018 high and turned lower. Crude is below its falling 40-week SMA and it looks like the bigger downtrend is resuming.
Gold Forms a Bull Wedge
I highlighted the Palladium ETF (PALL) on Thursday and would like to highlight the Gold SPDR (GLD) today. First, note that gold has gone nowhere the last three years and is currently in the middle of its 3-year range. Second, note that the Dollar is very strong and this is usually a negative for gold. On the price chart, GLD surged from 112 to 126 and then corrected with a falling wedge that retraced around 50%. The pattern and retracement are normal for pullbacks after sharp advances. GLD firmed the last five weeks with most price action occurring in a narrow range between 120 and 122. This signals support in the 120 area and a wedge breakout would be bullish. The indicator window shows the PPO (5,30,5) turning up and poised to cross above its signal line.

Art's Charts ChartList Update
The Art's Charts ChartList has been updated. There are only six active charts on this list and three will be removed after weakness this week. Note that this ChartList will change in the coming weeks and be based on a more systematic approach to picking stocks. The picks will be based on a scan and I will share the scan code, as well as the general strategy. Click here for the Art's Charts ChartList
Questions, Comments or Feedback?
I do not take symbol request and I cannot promise to response to all correspondence, but I will read it and take into under consideration. I greatly appreciate all feedback because it helps me improve the commentary and provides ideas for the future.

Plan your trade and trade your plan.
Arthur Hill, CMT
Senior Technical Analyst, StockCharts.com
Author, Define the Trend and Trade the Trend
Want to stay up to date with Arthur's latest market insights?
– Follow @ArthurHill on Twitter
– Subscribe to Art's Charts
– Watch On Trend on StockCharts TV (Tuesdays / Thursdays at 10:30am ET)


