- S&P 500 Crosses 200-day for Umpteenth Time.
- The S&P 500 versus a Slew of Negative Charts.
- Vietnam ETF Tests Breakout Zone.
- Frontier Markets ETF Nears Breakout.
... There sure is a lot of negativity out there as the S&P 500 toys with its 200-day SMA. This key US benchmark broke below the 200-day on Friday and this is the 184th time that the index has crossed this "key" moving average since January 1994. That averages around 7 crosses per year. Even though this cross has generated some great signals and foreshadowed some big trends, it has also produced a fair number of whipsaws. In fact, the index has crossed this moving average at least 12 times in the last 12 months (blue zones).
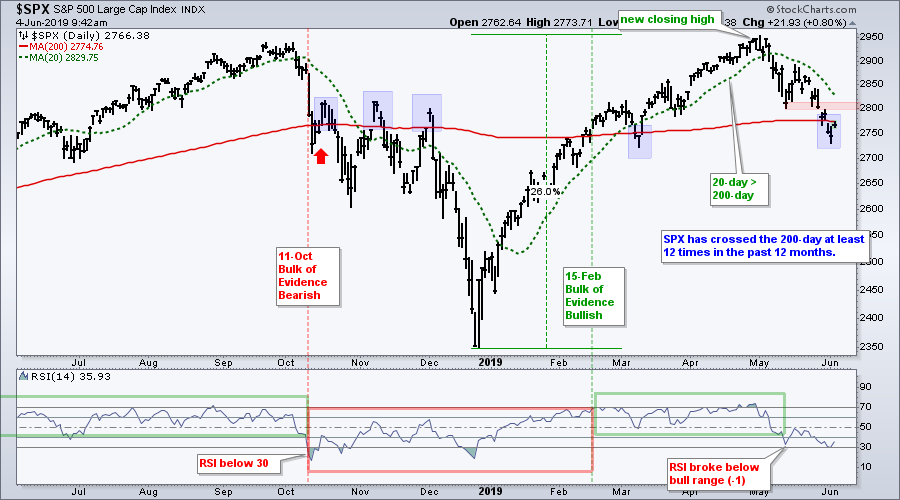
My research shows that the close/200-day cross is not the most effective long-term signal. Chartists can do better by smoothing the close with a 5 or 20 day SMA. I will cover these cross as well as backtest signals when the moving average turns up or down in Thursday show (On Trend). For now, the 200-day SMA is clearly a battle zone for the S&P 500 and the index is quite oversold after a 7% decline in less than 5 weeks. The combination is giving way to an oversold bounce as I write on turnaround Tuesday. Short-term, the 2800 area could mark the next resistance zone.
Parade of Negative Charts
Even though the S&P 500 has yet to turn bearish in my book, there are a slew of charts out there with negative implications for the broader stock market. Many of these charts are covered in today's show (On Trend). Technically, my model is still in bull market mode for the S&P 500 because the 20-day SMA is above the 200-day SMA and the breadth tables have yet to flip from net bullish to net bearish. Nevertheless, here are some bearish indications going forward:
- S&P 500 seasonal pattern negative (June to Sep)
- New lows expanded last week
- Less than 50% of Stocks above 200-day EMA
- Russell 2000 below falling 200-day SMA
- S&P Mid-Cap 400 below falling 200-day SMA
- AAPL, AMZN and GOOGL below 200-day SMAs
- Semiconductor iShares leading lower
- Equal-weight Consumer Discretionary ETF breakdown
- Retail SPDR breakdown
- Bonds surging and outperforming stocks (SPY:IEF)
- Low Volatility stocks outperforming High Beta Stocks SPHB:SPLV
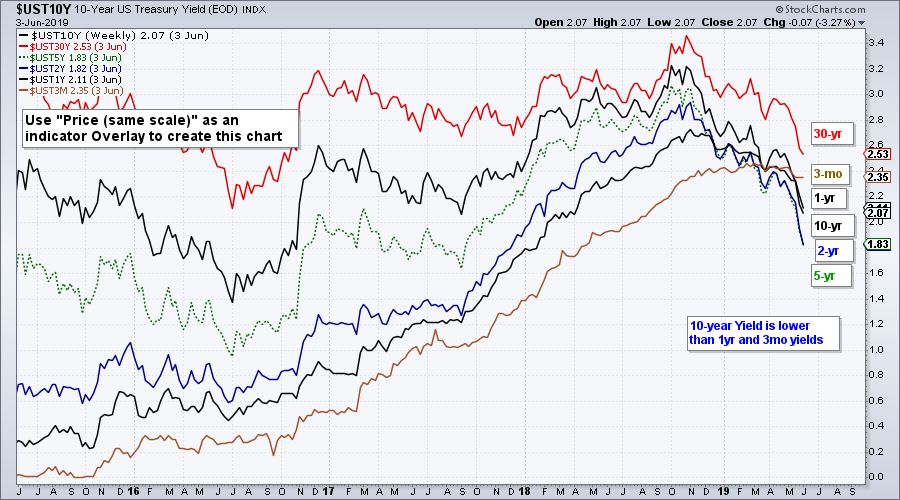
- 1 Year Yield is above 10 year Yield (partial yield curve inversion)
- 52-week low for 2-year Yield
Vietnam Finds Support at Break Zone
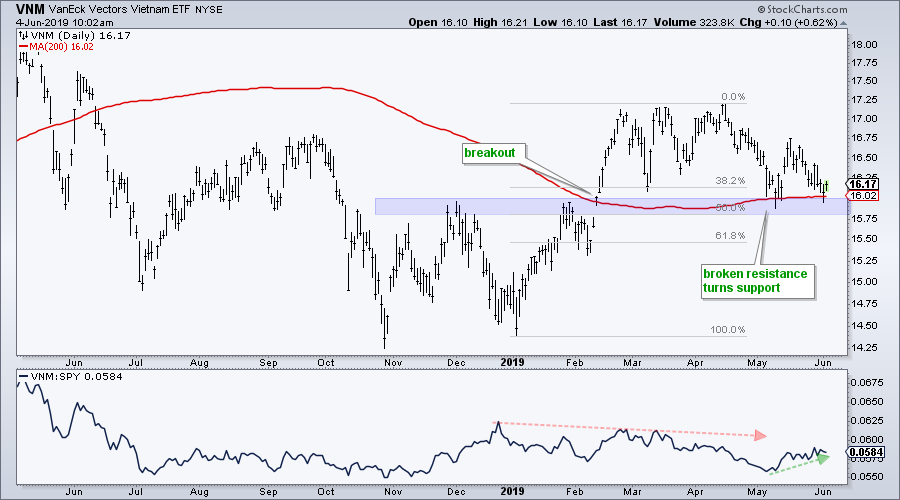
The Vietnam ETF (VNM) caught my eye because it held up relatively well in May and is testing the breakout zone. The ETF broke out with a big move in January-February and the zone around 15.75-16 turned into support. The ETF also broke the 200-day SMA and is testing this moving average on the pullback. In addition to support, the decline back to the 15.75-16 area retraced around 50% of the prior advance. Thus, this 15.75-16 area is looking like a possible reversal zone. Watch for a surge off support here to signal a resumption of the January-February advance. A close below 15.75 would call for a re-evaluation.
Frontier Markets Nears Breakout
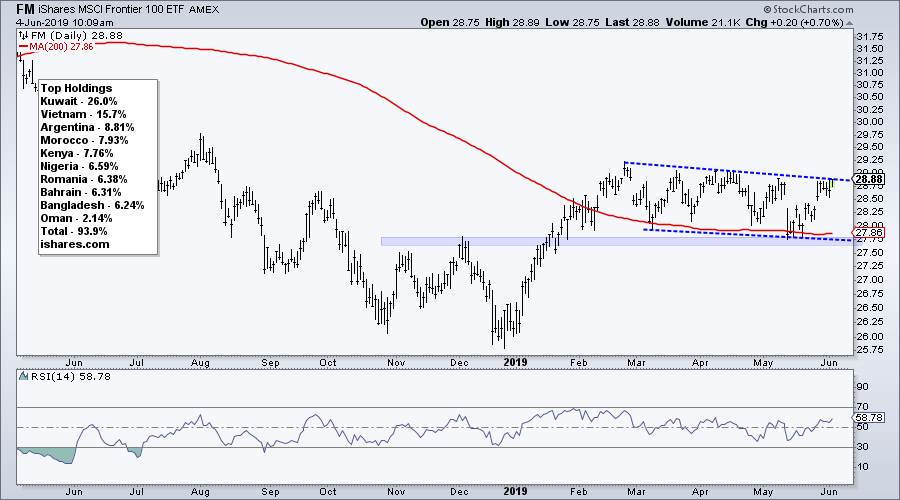
The Frontier Markets ETF (FM) also held up well in May and looks poised for a breakout. According to the iShares website, the top country holdings are Kuwait (26%), Vietnam (15.7%) and Argentina (8.8%). I never would have guessed Kuwait for the top holding. On the price chart, the ETF broke out with a surge in January-February and then corrected into May. The ETF found support near the breakout zone and the 200-day SMA in May and surged to the upper trend line of a falling channel. A breakout here would be bullish and signal a continuation of the January-February advance. Chartists can re-evaluate on a close below the May low.
On Trend on YouTube (Tuesday, June 4th)
- Charting with StockChartsACP
- S&P 500 Toys with 200-day
- Parade of Negative Charts (XRT, SPHB...)
- A Few ETFs Held Up in May (VNM, FM)
- Stocks: INCY, HXL, ROLL, TDY, HON
- Click here to Watch
Arthur Hill, CMT
Senior Technical Analyst, StockCharts.com
Author, Define the Trend and Trade the Trend
Want to stay up to date with the latest market insights from Arthur?
– Follow @ArthurHill on Twitter
– Subscribe to Art's Charts
– Watch On Trend on StockCharts TV (Tuesdays / Thursdays at 10:30am ET)


