Finding stocks with strong uptrends is the first step to stock selection during bull markets, and we are in a bull market. The S&P 500 hit a new all time high just last week, the largest sector (technology) is leading with XLK also hitting a new high last week and the Consumer Discretionary SPDR (XLY) hit new high. Even though there may be some lagging groups and stocks, the weight of the evidence is bullish for the broader market. Our job in bull markets is to find stocks with uptrends and bullish setups, and ignore stocks that are in downtrends or underperforming on the price charts. The next four stocks come from a scan featured in this System Trader article that uses RSI and Aroon to find stocks in strong uptrends. These stocks are also featured in On Trend, which can be seen on YouTube.
Cisco Forms Bullish Triangle
The first chart shows Cisco (CSCO) fitting my strong uptrend criteria since April 1st. The 20-day SMA (gray) moved above the 200-day SMA on January 31st, RSI(65) triggered on April 1st and Aroon (65) triggered on April 1st. Note that RSI(65) needs to exceed 55 and hold above 45 over a 65-day period. Similarly, Aroon Up needs to reach 100 and Aroon Down must not hit 100 over a 65-day period. This 65-day period ensures at least three months of strong uptrend and this is the point when the stock makes the scan results for further analysis.
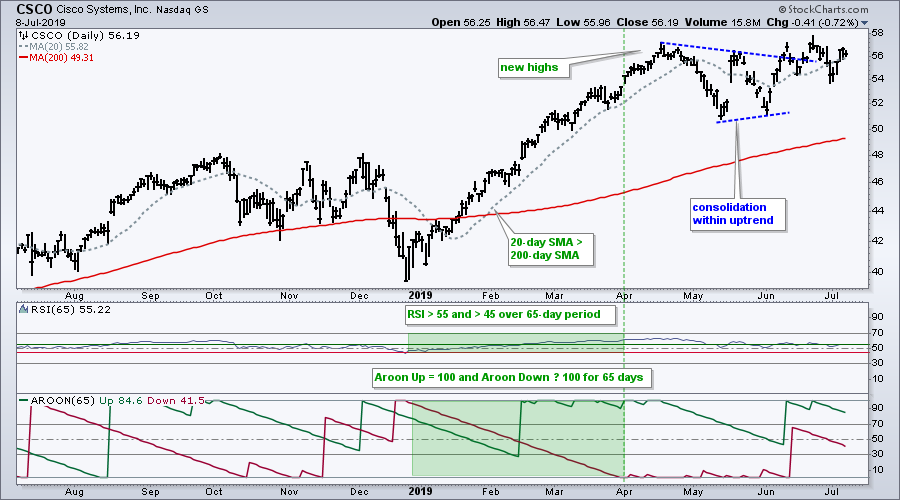
On the price chart, CSCO consolidated after hitting a new high. A consolidation after a strong advance is typically a bullish continuation pattern and the stock is trying to break out.
Lattice Consolidates Near Highs
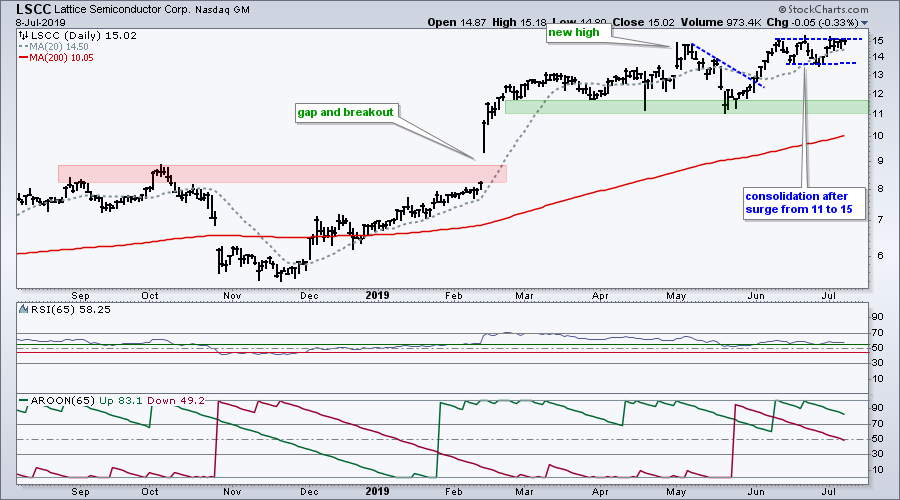
The second chart shows Lattice Semiconductor (LSCC) with a big breakout in February and new highs in spring. The stock tested support with a decline in May and then bounced to new highs in June. LSCC recently consolidated near its highs and looks poised for a breakout.
Momentum Turns up for Match
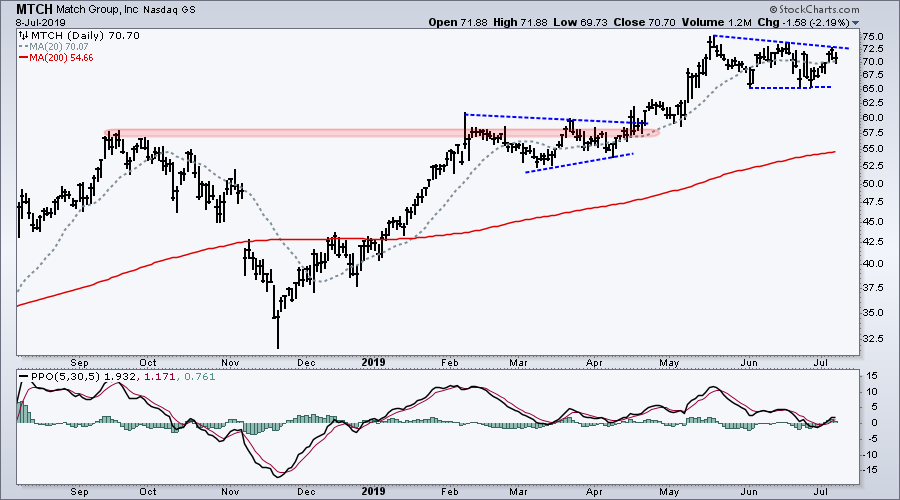
The third chart shows Match Group (MTCH) breaking out of a triangle consolidation in April and surging to new highs in May. The stock corrected into June with a falling wedge of sorts. Again, this looks like a consolidation within a bigger uptrend and this makes it a bullish continuation pattern. The indicator window shows the PPO (5,30,5) turning up over the last few days and moving back into positive territory. This means the 5-day EMA crossed above the 30-day EMA and momentum is turning up.
Twitter Hits Reversal Alert Zone
And last but not least, Twitter (TWTR) its bouncing off a reversal alert zone and the PPO turned up. First, notice that TWTR formed a base from September to March with two bounces off support in the 27 area. The stock then broke the red resistance zone with a gap and surge in April. This looks like a bullish breakout.
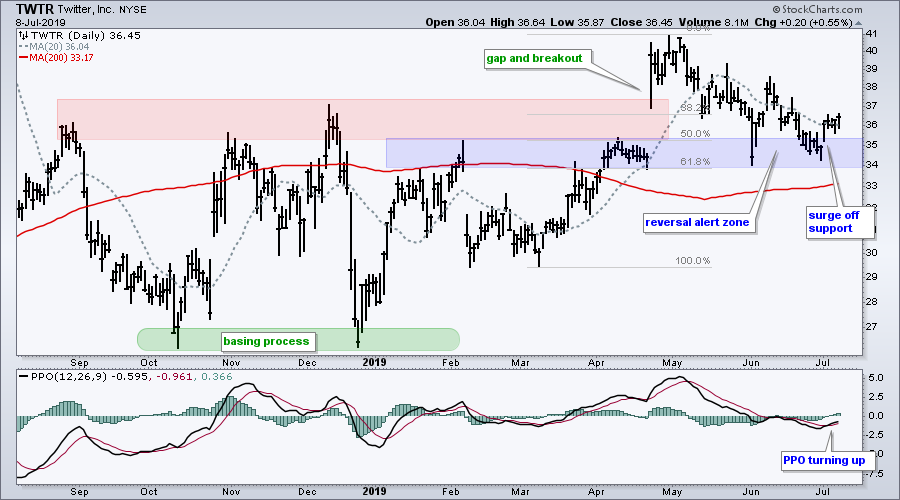
The blue zone marks a reversal alert zone based on three parts. First, the March-April surge is an impulse move and the decline into June is a correction. Second, the broken resistance zone in the 34-35 area turns support (blue area). Third, the May-June decline retraced 50-61.8% of the March-April advance. A "normal" correction should find support near broken resistance and after a ~50 percent retracement. TWTR indeed found support with a big bounce in early June and another bounce on July 1st. The most recent bounce suggests that the correction is ending and the bigger uptrend is resuming.
On Trend on YouTube (Tuesday, July 9th)
- Staples, Utes and REITs are not Alone
- Oil and Energy - A Breakout or a Reversal?
- Insurance Looks good, but Banks do Not
- Four Growth Stocks with Bullish Setups
- Click here to Watch
Arthur Hill, CMT
Senior Technical Analyst, StockCharts.com
Author: Define the Trend and Trade the Trend
Paper: RSI for Trend-Following and Momentum Strategies
Want to stay up to date with the latest market insights from Arthur?
– Follow @ArthurHill on Twitter
– Subscribe to Art's Charts
– Watch On Trend on StockCharts TV (Tuesdays / Thursdays at 10:30am ET)


