There is much more to a sector than its price chart and StockCharts has the data to take your sector analysis to the next level. Yes, I am talking about the unique breadth indicators that our crack data team calculates and publishes every day. These indicators include AD Percent, High-Low Percent, %Above 200-day EMA, AD Volume Percent and the Bullish Percent Indexes. Personally, I use the first three to assess each sector and the health of the broader market. The table below shows the sector symbols for AD Percent.
Brief Explanation of Indicators
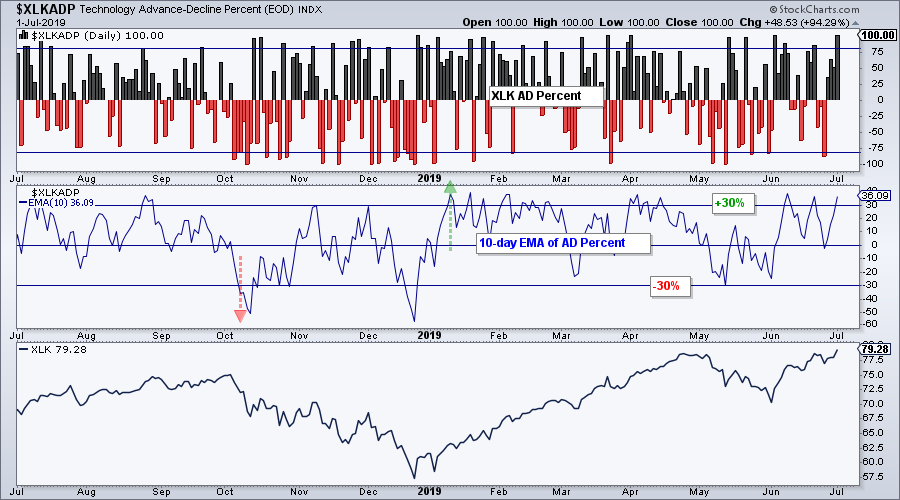
AD Percent shows net advances as a percent of total issues (advances less declines divided by total issues). As such, it measures upside or downside participation. A bullish breadth thrust triggers when the 10-day EMA of AD Percent moves above +30%, while a bearish breadth thrust triggers when the 10-day EMA of AD Percent moves below -30%. The chart below shows the indicator for XLK triggering bearish in early October and bullish in early January.
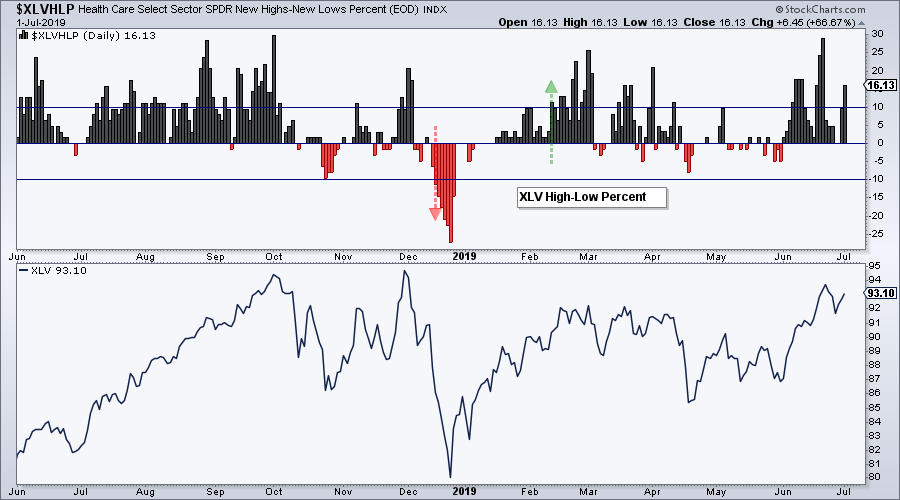
High-Low Percent is net new highs as a percentage of total issues. It measures the percentage of stocks in strong uptrends (new highs) or strong downtrends (new lows). The indicator triggers bullish with a move above +10% and bearish with a move below -10%. Note that I am looking for solid signals of strength or weakness. Instead of using crosses above/below the zero line for High-Low Percent, I am setting my bullish threshold at +10% and bearish threshold at -10%. The chart below shows Healthcare High-Low% ($XLVHLP) triggering bearish in mid December and bullish in mid February.
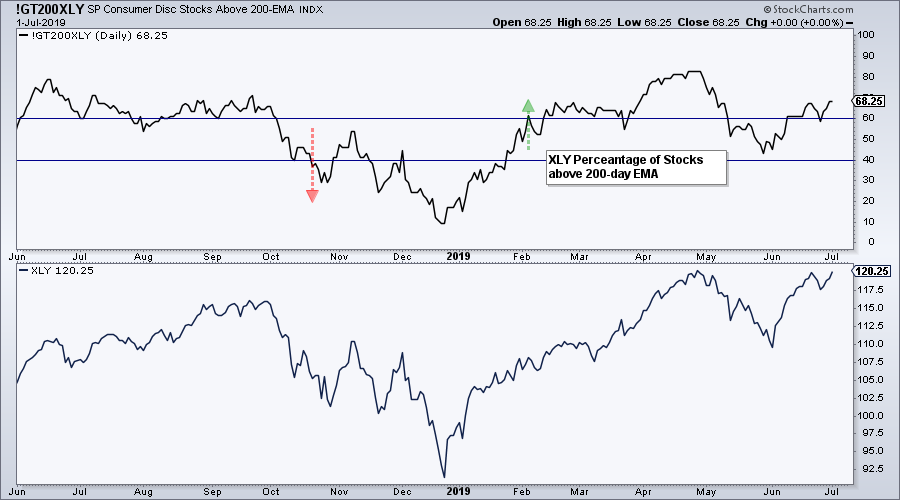
%Above 200-day EMA measures the number of stocks in uptrends. A move above 60% is considered bullish, while a move below 40% is considered bearish. As with High-Low Percent, I am looking for critical mass by not using crosses of the 50% level for signals. Setting my bullish threshold higher (60%) and my bearish threshold lower (40%) also helps to reduce whipsaws.
I become bullish on the sector when at least two of the three are on active bullish signals and bearish when at least two of the three are on active bearish signals. Even though I have yet to backtest these signals, anecdotal evidence suggests fewer whipsaws than traditional chart signals, such as a cross above/below the 200-day SMA.
XLE is the Only Bearish Sector
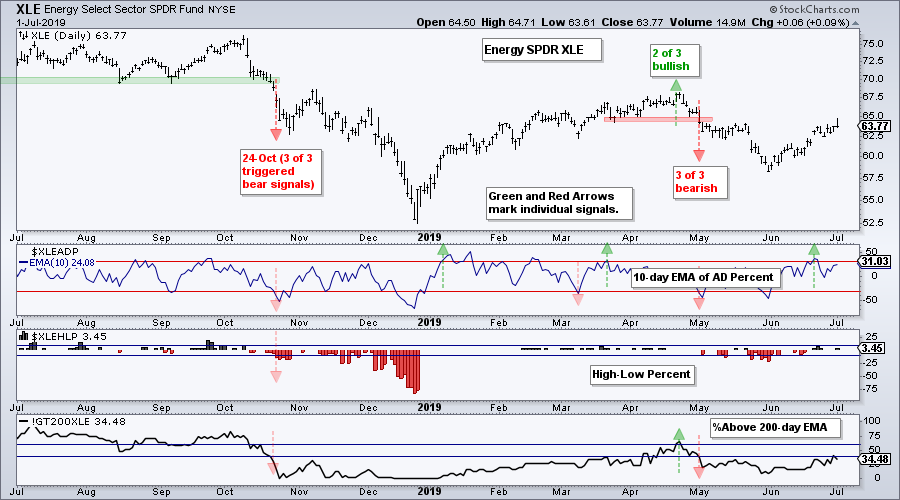
Of the eleven sector SPDRs, the Energy SPDR (XLE) is the only sector with two or more breadth indicators on active bearish signals (red arrows). XLE High-Low% ($XLEHLP) triggered bearish way back in October and remains on a bearish signal. Energy %Above 200-day EMA (!GT200XLE) triggered bearish on May 1st and remains bearish. The 10-day EMA of AD Percent triggered bullish in June, but this alone is not enough to turn the group bullish (weight of the evidence).
XLE and Oil hit Reversal Alert Zones
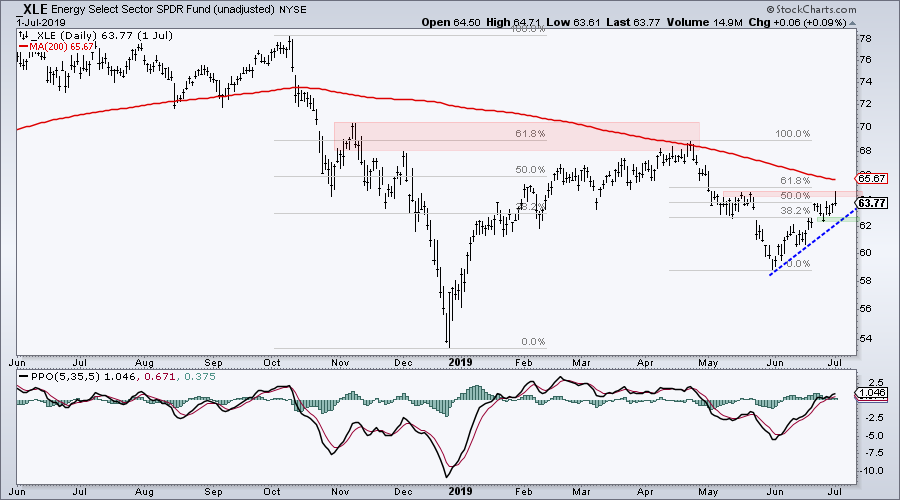
With the breadth indicators net bearish for XLE, I favor bearish setups over bullish setups on the price chart. And...it just so happens that XLE is trading in a reversal alert zone, of the bearish variety. In fact, this zone is just a smaller version of the reversal alert zone seen in April (red area). First, the June rebound looks like a counter-trend bounce after a sharp decline in April-May. Second, the counter-trend bounce entered the 50-61.8% retracement zone. Thus, April-May represents two steps down (impulse move) and the June bounce represents one step up (counter-trend move). Third, there is resistance from the mid May high in the 64-65 area. All told, the breadth evidence is net bearish and a bearish reversal alert zone is nigh. A break below the late June low would reverse the short-term uptrend and provide the first confirmation of a short-term trend reversal on the price chart.
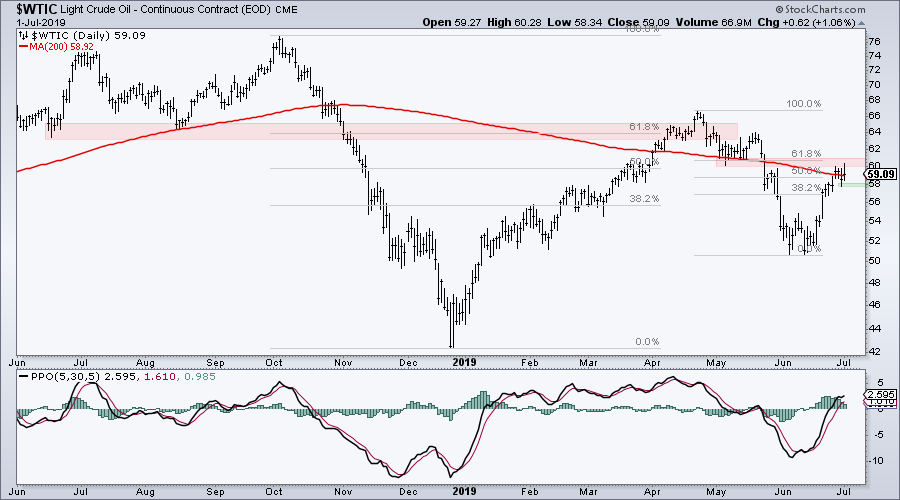
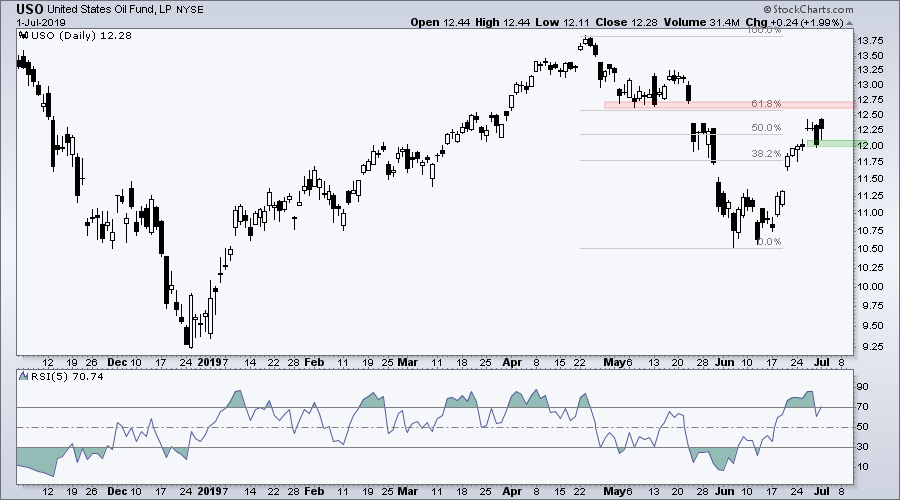
The next chart shows the Light Crude Continuous Contract ($WTIC) rebounding with a 15% surge over the last three weeks. It certainly looks impressive from a percentage standpoint, but note that oil is now trading in the 50-61.8% retracement zone and broken support turns into resistance in the 60-61 area. This is a reversal alert zone and a break below Friday's low would reverse the short-term bounce.
On Trend on YouTube (Tuesday, July 2nd)
- Market Condition Matters
- Cannabis Stocks Reach Reversal Alert Zones
- Diving into the Cyber Security Group
- Oil and XLE Hit Resistance Zones
- Retail Stocks Still Suffering
- Click here to Watch
Arthur Hill, CMT
Senior Technical Analyst, StockCharts.com
Author: Define the Trend and Trade the Trend
Paper: RSI for Trend-Following and Momentum Strategies
Want to stay up to date with the latest market insights from Arthur?
– Follow @ArthurHill on Twitter
– Subscribe to Art's Charts
– Watch On Trend on StockCharts TV (Tuesdays / Thursdays at 10:30am ET)

