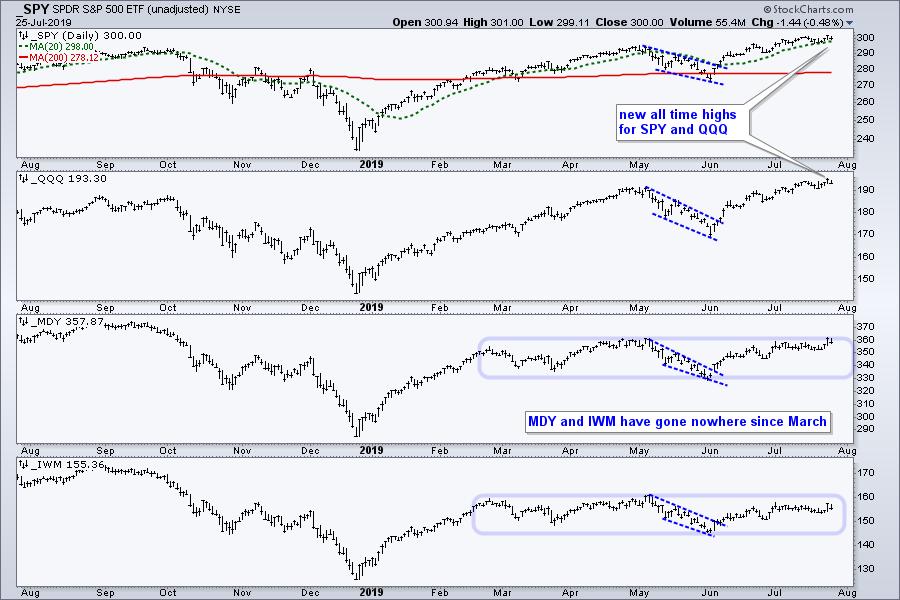
... The S&P 500 SPDR hit another new all time high this week, while small-caps and mid-caps came alive, if just for one day. Even though small-caps and mid-caps are lagging since March, the new high in the S&P 500 affirms the bull market environment. Keep in mind that the S&P 500 accounts for some 80% of the total US equity market. It is the 800-pound index in the room. We also saw a new high in the Nasdaq 100 ETF and this reflects leadership in the technology sector.
Index Table Improves
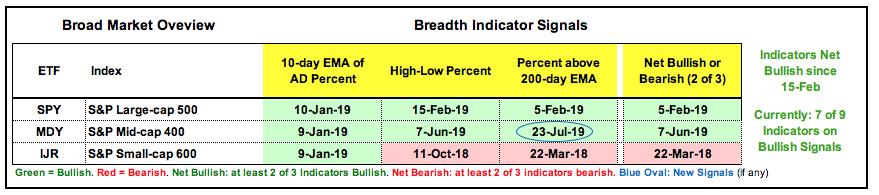
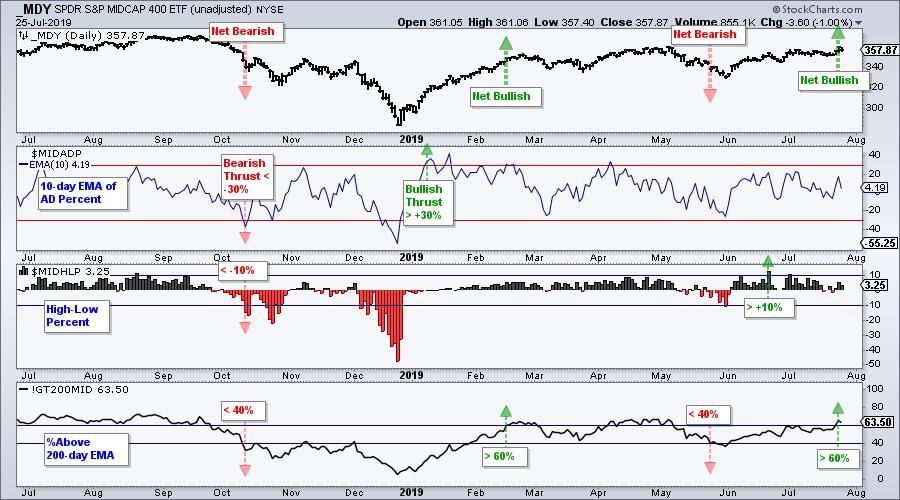
Mid-caps perked up this week as the Mid-Cap %Above 200-day EMA (!GT200MID) moved above 60% to trigger a bullish signal. All three mid-cap signals are bullish now and the S&P Mid-Cap 400 joins the S&P 500 with three of three signals bullish. Small-caps are still net bearish with two of the three signals bearish. Overall, seven of the nine signals are bullish and this is enough to be bullish on the broader market.
SPY Breadth Chart - MDY Breadth Chart - IJR Breadth Chart
Keep in mind that the index and sector tables are designed to capture the state of the market right now. These tables represent a trend-following approach to the broader market. We are in a bull market environment when the weight of the evidence is bullish. As with trend-following and Dow Theory, we do not know how long a bull market environment will last or how far the major indexes will extend. The bulls simply reign until proven otherwise. In other words, I do not change my position under the evidence changes.
XLK, XLY and XLC Lead Latest Upswing
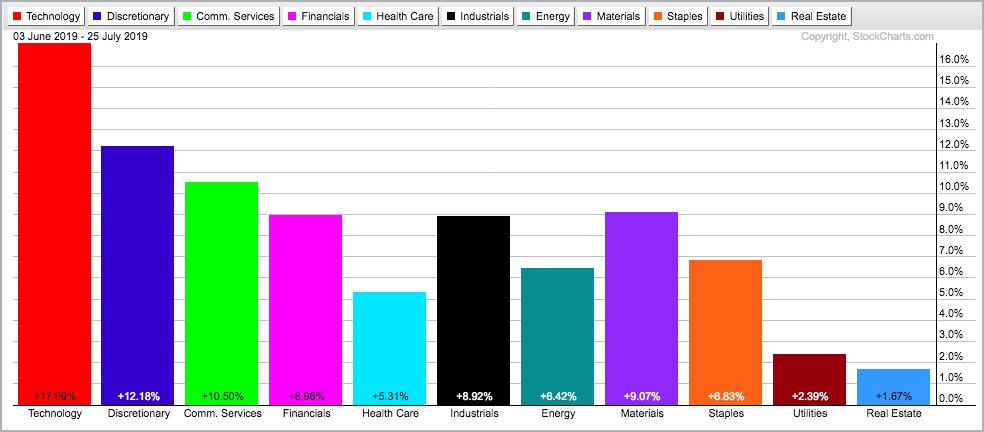
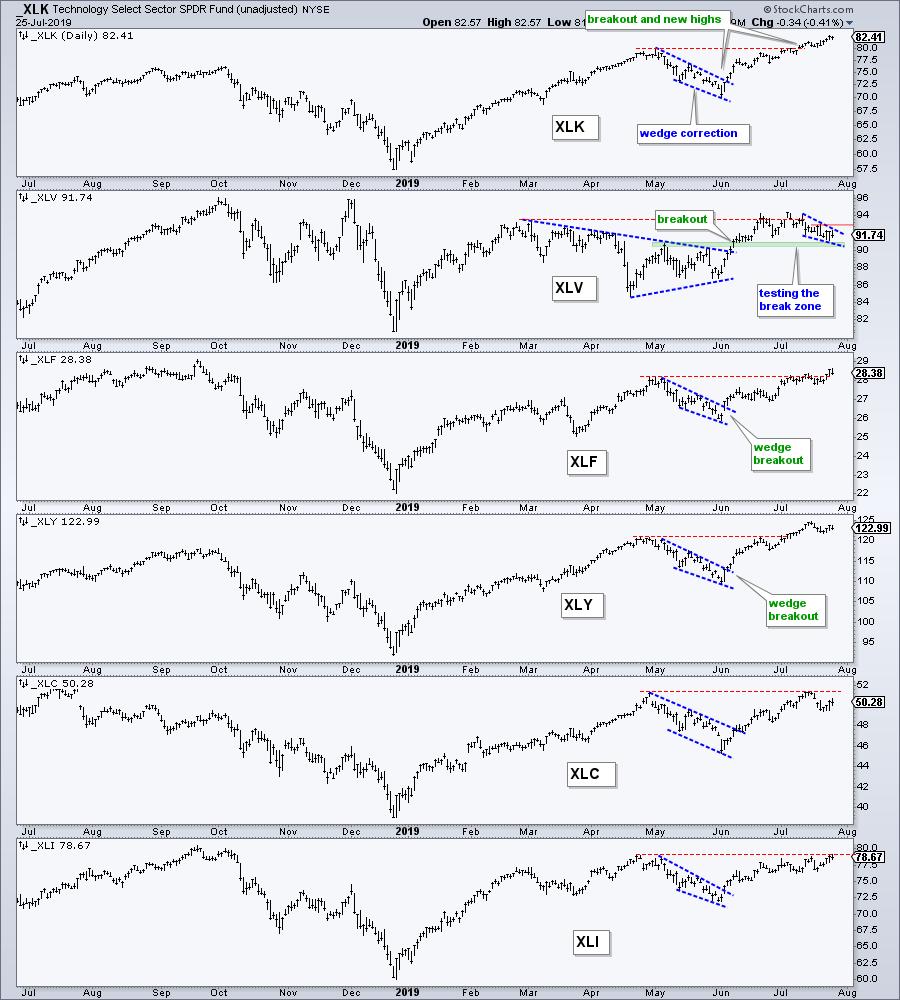
The most recent market trough occurred 37 days ago on June 3rd. Since then, the offensive sectors have outperformed with the Technology SPDR (XLK) surging some 17%, and hitting 52-week highs the last few weeks. While such a strong move in a short period of time reflects strong buying pressure, XLK and some of the sectors are getting a bit frothy short-term. This condition could give way to a corrective period, such as a pullback or trading range. XLK, XLY and XLC led the latest upswing with double-digit gains. XLF, XLI and XLB also performed well with ~9% gains.
The next chart shows the six biggest sectors in the S&P 500. Together, these six sectors account for around 79% of the index. Five of the six are offensive sectors (healthcare is not an offensive sector). XLV broke out of a triangle in June and is testing this breakout zone, which turns support. The other five corrected in May, reversed in early June with wedge breakouts and surged the last 37 days. XLK, XLY and XLF exceeded their prior peaks (red lines) and are the chart leaders.
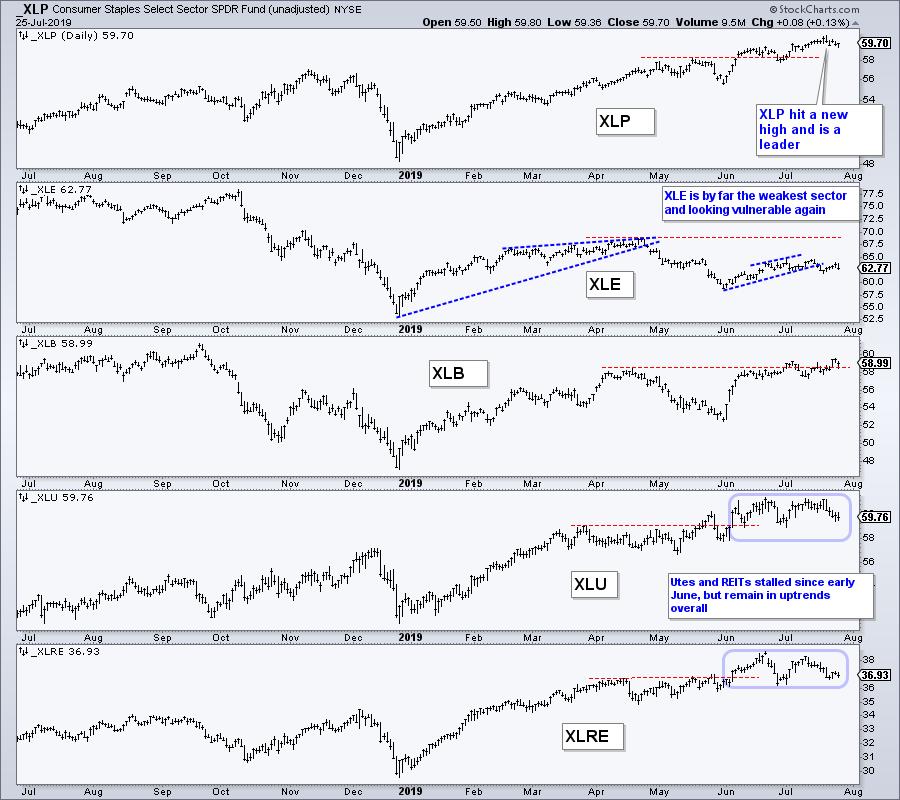
The next chart shows the other five sectors, which account for less than 22% of the S&P 500. XLP is the clear leader with a new high in mid July. XLE is by far the weakest and looks vulnerable to another break down, as does oil. XLB exceeded its April high and shows renewed life. XLU and XLRE stalled out over the last eight weeks, but have yet to break down.
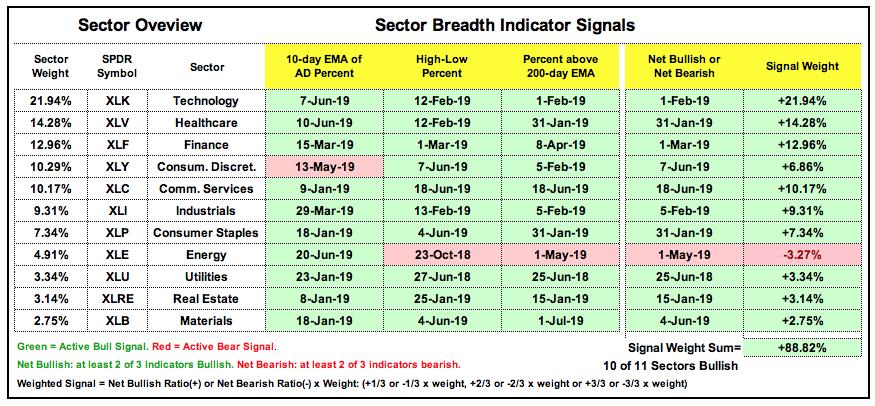
10 of 11 Sectors Net Bullish
The sector breadth table remains firmly bullish with no changes. The Materials %Above 200-day EMA (!GT200XLB) triggered bullish on July 1st, but was not marked on the table until this week. XLB is a small sector (2.75% of SPY) and two of the three indicators were already bullish so this change did not affect the table much. Overall, 30 of 33 signals are bullish and there are no signs of material weakness within the S&P 500.
State of Stock Market Video
This week's video was produced on Thursday and featured in On Trend.
- The State of the Stock Market.
- New Signal from Mid-Cap %Above 200-day EMA
- Breadth and Price Charts for XLI, XLV and XLF
- Leading ETFs Making New Highs in July.
- Reversal Alert Zones (RAZ's) in IBB and XBI
Questions, Comments or Feedback?
Email: arthurh@stockcharts.com
Twitter: @arthurhill
Art's Charts ChartList Update
The Art's Charts ChartList has been updated with 30 curated stock charts. These charts were selected based on observations this week and the RSI-Aroon chart scan in this System Trader article. Some charts remain from week to week and some change. The idea is to provide a curated list of stocks to watch for the week(s) ahead.
Click here for the Art's Charts ChartList
Choose a Strategy, Develop a Plan and Follow a Process
Arthur Hill, CMT
Chief Technical Strategist, TrendInvestorPro.com
Author, Define the Trend and Trade the Trend
Want to stay up to date with Arthur's latest market insights?
– Follow @ArthurHill on Twitter


