Stocks were pummeled on Monday with the S&P 500 falling the most (2.98%) since December 2018. The Russell 2000 and Nasdaq 100 also fell more than 3% with widespread selling pressure. I am not going to start the blame game (tariffs, the Fed, early August seasonal patterns, the economy, earnings etc...). Truth be told, there are a myriad of reasons for market moves and we cannot expect to know the details behind every move. Moreover, if you are going to blame the recent decline on tariff issues, then you must follow this issue closely and base future decisions on new developments. Boy, wouldn't that be fun.
Alternatively, you can study the charts, devise a strategy with rules and abide by the signals. I know which option I will choose.
------------------------------------------------------------
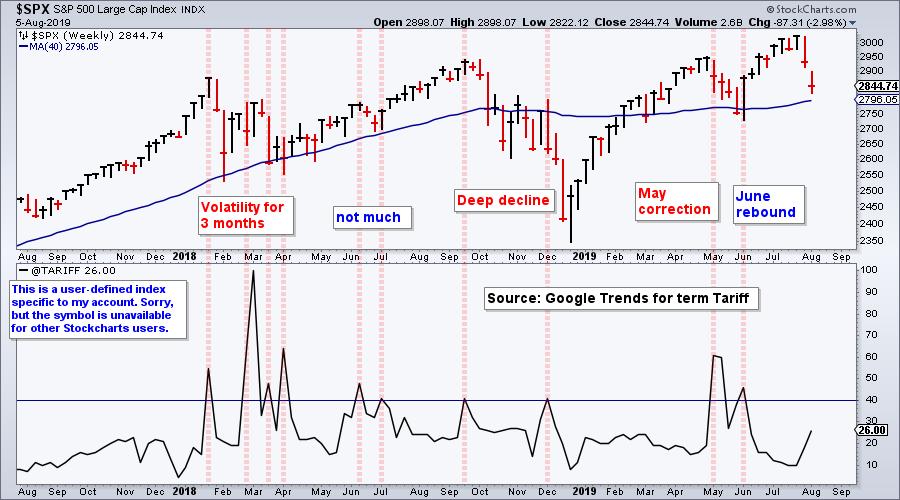
Spikes in Tariff Interest and the S&P 500
While I must admit that the tariff issue could be a pretty big deal, I am not going to go into the details and ramifications. And, I am certainly not going to predict an outcome! The chart below shows the S&P 500 over the last two years with a Google trends indicator showing the popularity of the search term "tariff". The red lines show when the popularity exceeds 40 with at least ten occurrences. There are also five different periods, as far as I can tell. Based on prior occurrences, we can expect volatility (Jan-Mar), a deep correction (Oct-Dec), a normal correction (May) or a rebound (June). Yep, it's anyone's guess.
------------------------------------------------------------
S&P 500 Remains in Uptrend
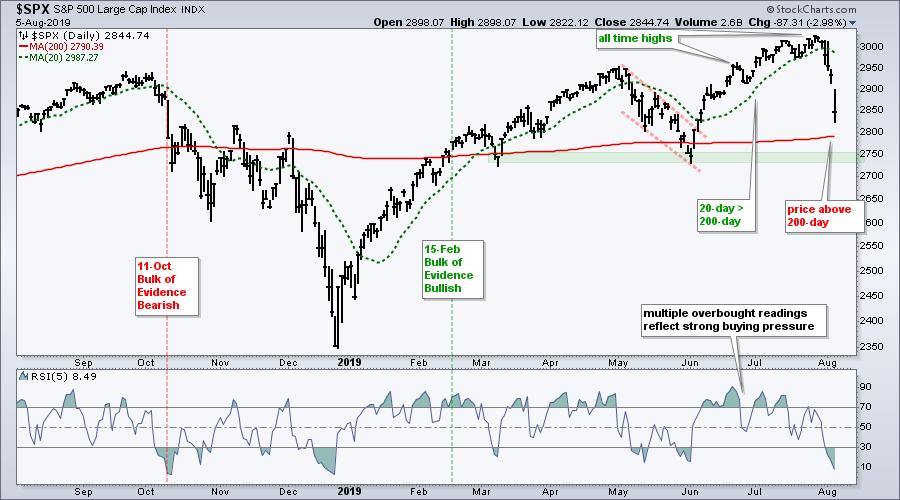
As the chart above shows, this tariff stuff has been going on since January 2018. Since then, the S&P 500 hit new all time highs in September 2018, April 2019 and July 2019. Of course, the index also recorded a 52-week low in December 2018 and this is why the dreaded broadening formation is a possibility (see Saturday's commentary).
It is important that we keep perspective and take signals based on the charts. The S&P 500 advanced around 10% from early June to late July, notched a new high and then fell around 6%. This sharp decline reversed the short-term uptrend, but the long-term uptrend remains in place. The 20-day SMA is above the 200-day SMA, and price is above the 200-day SMA. The March-May lows mark a support zone in the 2750 area. A break below the June low would forge a lower low and call for a reassessment of the long-term uptrend.
------------------------------------------------------------
Bearish Breadth Signals Weigh
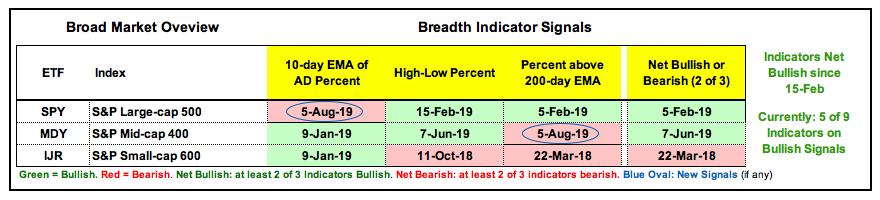
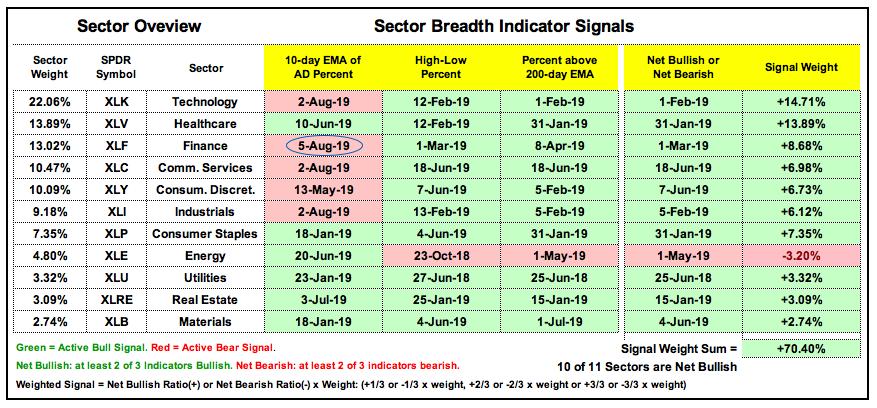
There were a couple more bearish signals on the index and sector breadth charts on Monday so I will update both breadth tables. The 10-day EMA of S&P 500 AD Percent ($SPXADP) plunged below -30% for a bearish breadth thrust. This signal reverses the bullish breadth thrust in early January. Two of the three indicators are still bullish for the S&P 500 so this index remains net bullish. Mid-Cap %Above 200-day EMA (!GT200MID) moved below 40% to trigger bearish. With two new bearish signals, five of nine indicators are bullish and one more flip to turn the weight of the evidence bearish.
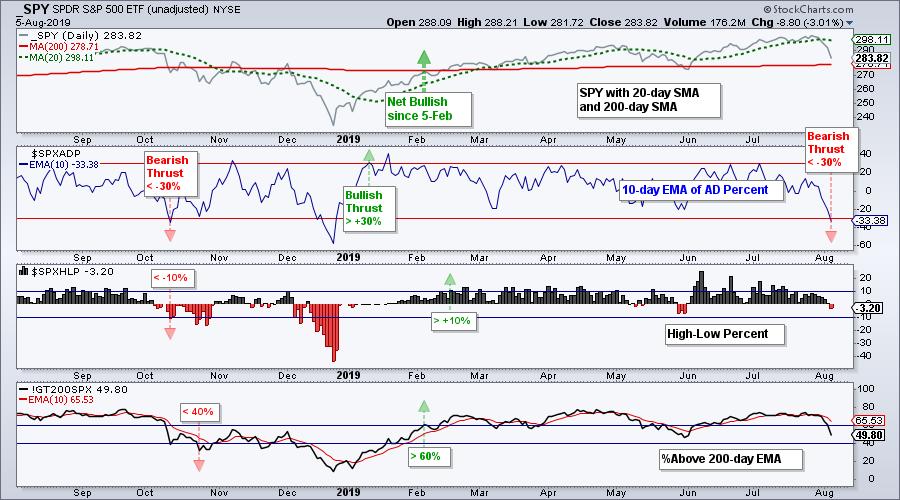
There was only one new signal on the sector breadth table. The 10-day EMA of XLF AD Percent ($XLFADP) plunged below -30% for a bearish breadth thrust. This means five of the six biggest sectors have active bearish breadth thrust signals. The breadth thrust indicators are the early warning indicators and were the first to turn in early January. High-Low Percent and %Above 200-day EMA then followed with a few weeks lag. This is the warning shot for the bulls and further weakness, such as in October 2018, could quickly flip the script.
------------------------------------------------------------
Comparing Now with October 2018
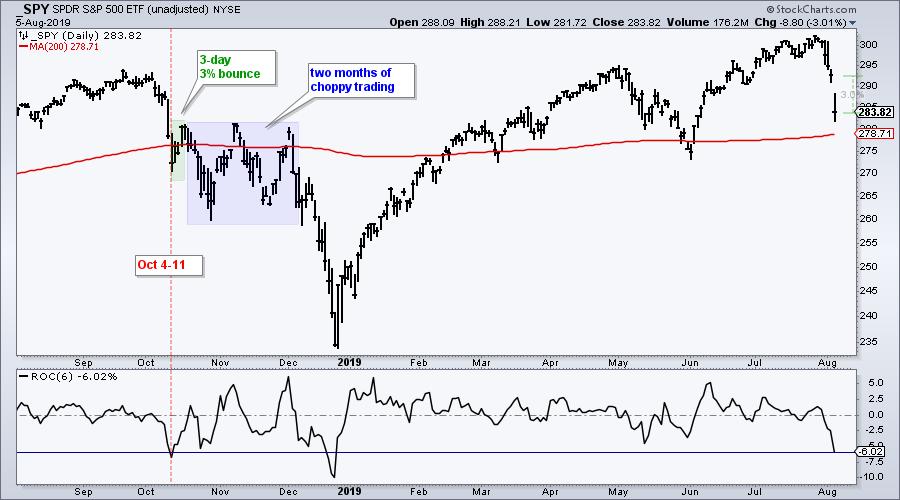
Now let's look at the October 2018 decline. The current decline is the sharpest 6-day fall since December and compares to the 6.7% 6-day decline in October (4 to 11). This decline started near a 52-week high and a 3-day 3% bounce followed. Mean-reversion traders would have needed a profit-target exit to profit here (exit on 2% gain). A 3% bounce from current levels would carry SPY back to the 292 area.
------------------------------------------------------------
Oversold Indicators and Retracements
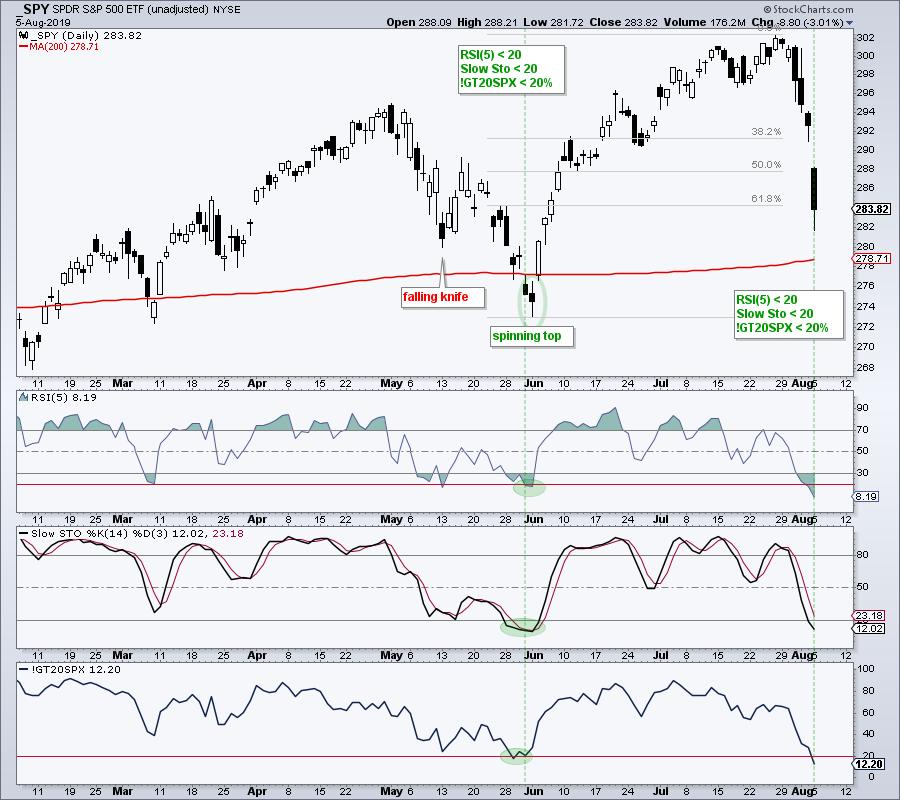
Looking at the current decline, SPY is oversold and trading near a potential reversal zone. The ETF retraced 61.8% of its prior advance and this is an area to expect a bounce, especially when short-term oversold. Notice that RSI(5) is at its lowest level in months, the Stochastic Oscillator is below 20 and S&P 500 %Above 20-day EMA (!GT20SPX) is below 20%. This is similar to the scenario in late May and early June.
------------------------------------------------------------
Bottom Line
Playing a bounce at this stage is purely short-term (a few days, not weeks). Traders need a clear exit strategy and a sound understanding of mean-reversion trading. Looking out a few weeks, the current bout of selling pressure looks similar to October and it could take a few weeks or even months to stabilize. The S&P 500 was volatile for two months after the initial decline in October 2018 and for three months after the initial decline in January 2018. Both initial declines started near new highs and were very sharp. I would not be surprised to see a couple months of volatile trading as the market finds its footing.
------------------------------------------------------------
Follow me on twitter: @arthurhill
Email comments: arthurh@stockcharts.com
--------------------------------------------------------------
Choose a Strategy, Develop a Plan and Follow a Process
Arthur Hill, CMT
Chief Technical Strategist, TrendInvestorPro.com
Author, Define the Trend and Trade the Trend
Want to stay up to date with Arthur's latest market insights?
– Follow @ArthurHill on Twitter


