Stocks were hit with some of the strongest selling pressure since December as the S&P 500 fell 3.10% and the Nasdaq 100 fell 4.04%. These weekly declines were the largest since mid December. The Russell 2000 held up the best with a 2.87% decline, which was the largest decline since late May.
Contrary to popular belief, relative strength in the Russell 2000 is actually a negative for the broader market because there are two sides to relative performance. Relative strength in the Russell 2000 means relative weakness in the S&P 500. The S&P 500 accounts for some 80% of the US equity market and is the 800 pound gorilla in the market. The S&p 500 drives bull and bear markets, not the Russell 2000. One week does not a trend make, but further underperformance by the S&P 500 would be a major negative for the broader market.
------------------------------------------------------------
Index Table Remains Bullish for S&P 500
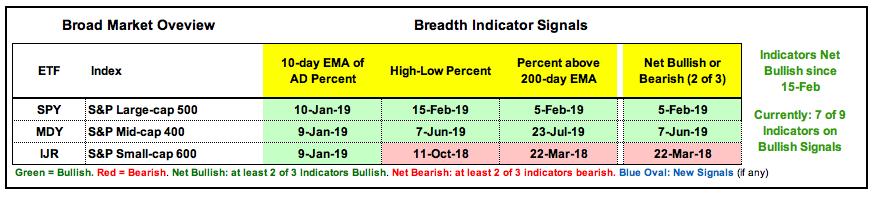
This week's selling pressure was not enough to affect the index breadth table, which was updated on Friday in detail. The table below shows the S&P 500 as net bullish since February 5th, the S&P Mid-Cap 400 as net bullish since June 7th and the S&P Small-Cap 600 as net bearish since March 2018. Small-caps never got involved in the 2019 bull run. Mid-caps are somewhere in the middle and large-caps are still the leaders.
------------------------------------------------------------
Three New Signals for Sector Table
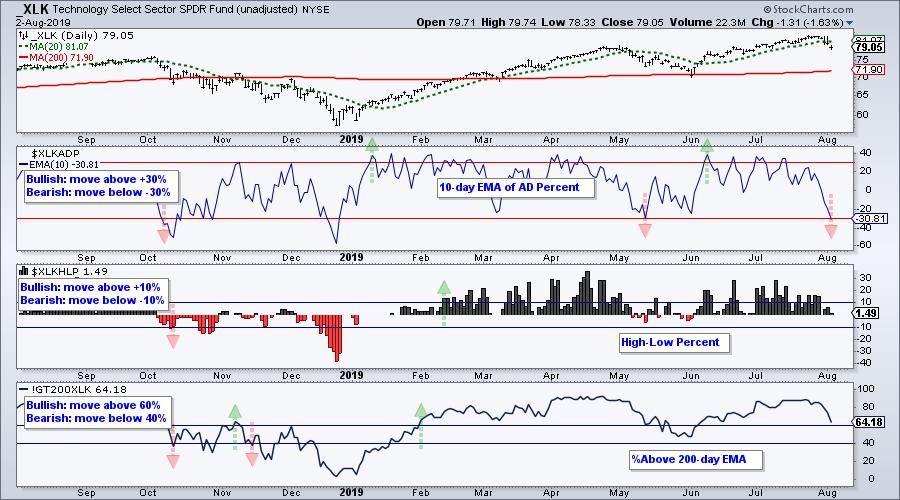
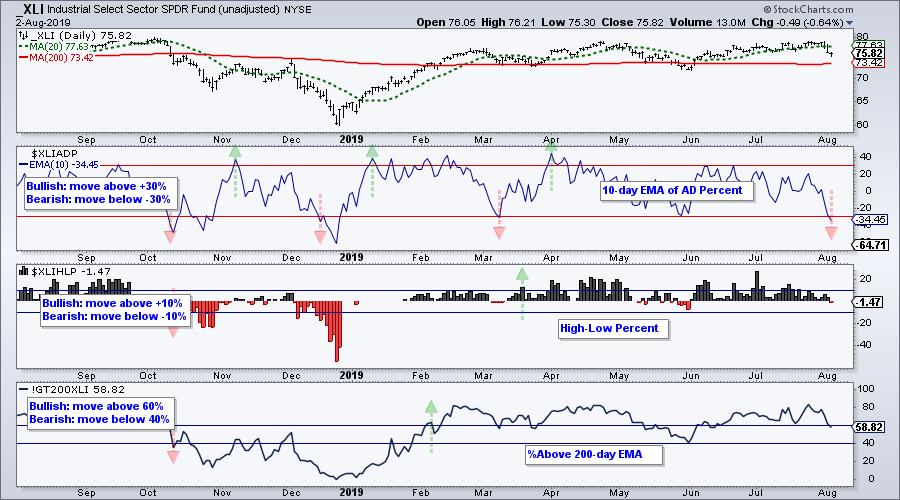
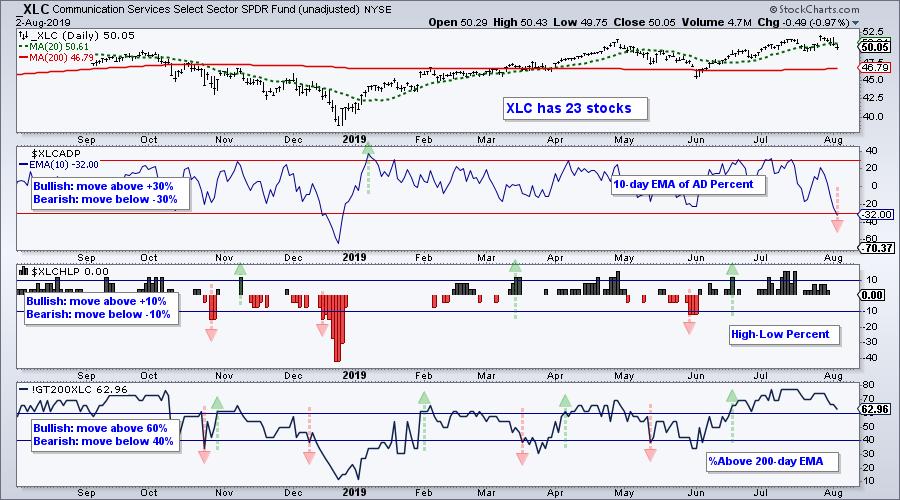
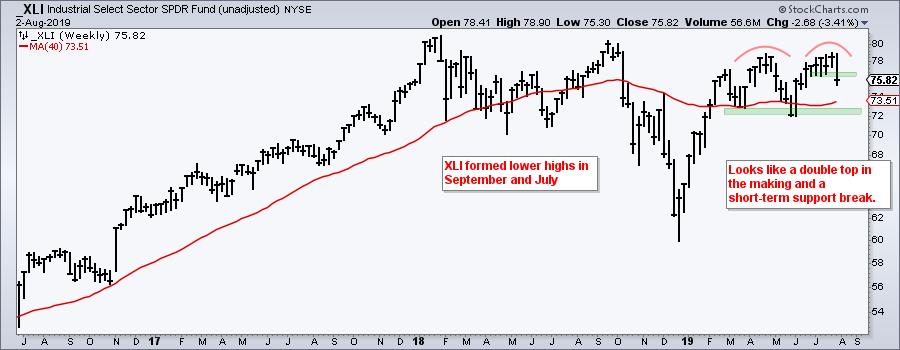
There were, however, some changes in the S&P 500 Sector table and this is a concern. Namely, we saw bearish breadth thrusts in the Technology SPDR (XLK), Industrials SPDR (XLI) and Communication Services SPDR (XLC) as the 10-day EMA for AD Percent moved below -30%. These three sectors account for over 40% of the S&p 500. AD Percent is the leading indicator of the three breadth indicators and, by extension, the one that is most prone to whipsaws. High-Low Percent and %Above 200-day EMA lag more and produce fewer whipsaws. Nevertheless, the fact that three key sectors triggered bearish breadth thrusts is a shot across the bow for the bulls. The bearish breadth thrusts reflect a sharp increase in downside participation within these sectors.

------------------------------------------------------------
Bearish Breadth Thrusts
The chart below shows the 10-day EMA of Technology AD% ($XLKADP) triggering bearish in mid May, bullish in early June and bearish in early August (red/green arrows). This week's bearish breadth thrust could signal the start of a corrective period for the largest sector in the S&P 500.
The next chart shows the 10-day EMA of Industrials AD% ($XLIADP) moving below -30% and reversing the signal from March 29th.
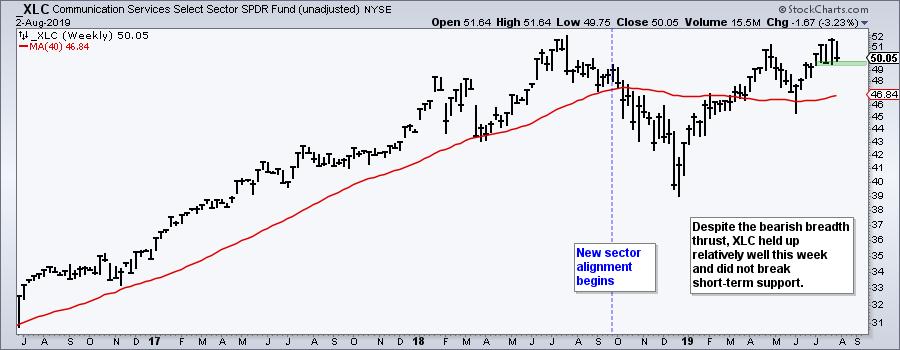
The next chart shows the 10-day EMA of Communications Services AD% ($XLCADP) moving below -30% to reverse the bullish signal from early January. Note that this sector has just 23 stocks, which could explain the unusually large number of signals in the other two indicators. In contrast, XLI and XLK have more than 60 stocks (components).
------------------------------------------------------------
The Broadening Formation Returns
Now let's check the charts, starting with the S&P 500 SPDR (SPY). Yep, the broadening formation is back in play after the short-term support break and breadth thrusts shown above. The chart below shows the swings widening since early 2018 (-11.8%, +15.3%, -20.3% and +29.7%). I do not know if this widening will continue, but it does reflect a market that is prone to big moves in a relatively short period of time. Note that the two declines were much shorter (time-wise) than the two advances. This suggests that the market takes the stairs higher and the elevator lower. SPY broke short-term support this week and forged a five week low. At the very least, a corrective period appears in order and this could mean a pullback to the 280 area.
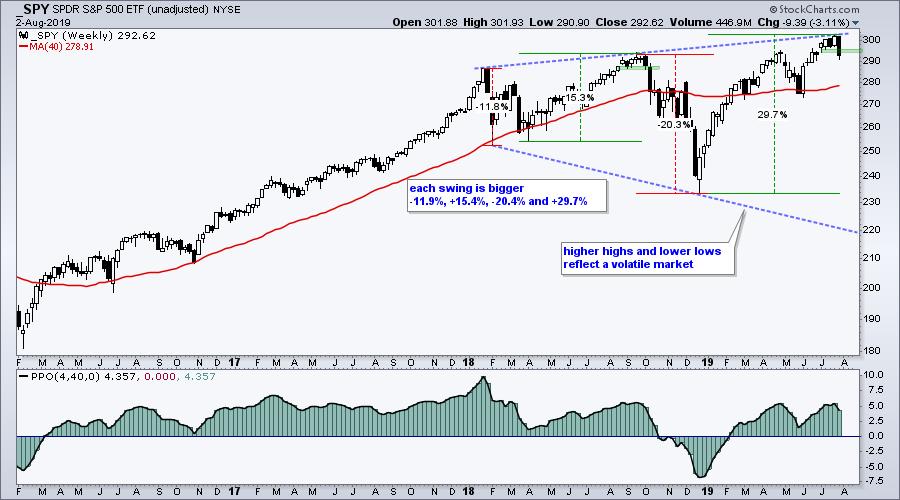
Before looking at the next charts, keep in mind that SPY hit new highs in spring and summer, and did NOT break its February low in early June. These are the "benchmark" highs and lows we can use to compare chart performance.
------------------------------------------------------------
Russell 2000 ETF in Long-term Downtrend
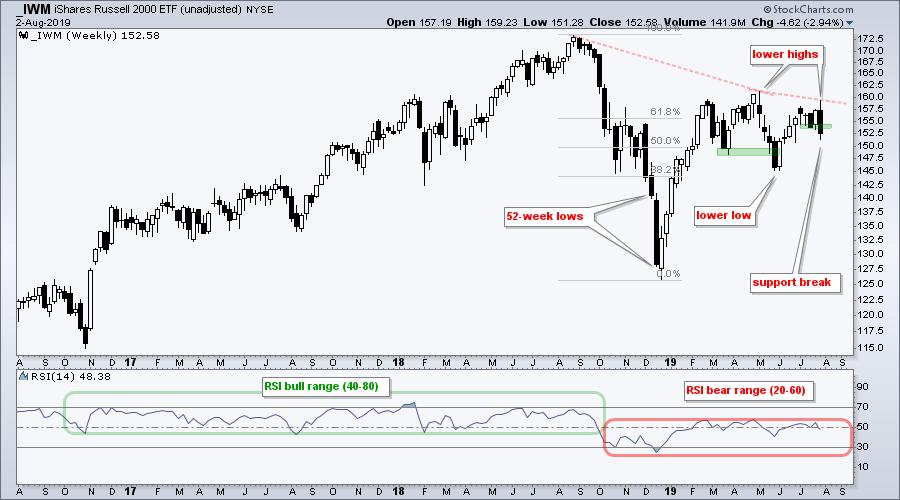
The Russell 2000 iShares (IWM) is not a happy camper. The ETF triggered a flag breakout on the daily charts with a surge last week, but gave it all back with an even bigger decline this week. Overall, the weekly chart below sports 52-week lows in December, a lower high near the 61.8% retracement in April, a lower low in May and another lower high now. While SPY was holding prior lows and making higher highs, IWM was breaking prior lows and forming lower highs. The indicator window confirms the long-term downtrend as RSI moved from a bull range (green zone) to a bear range (red zone) in October.
------------------------------------------------------------
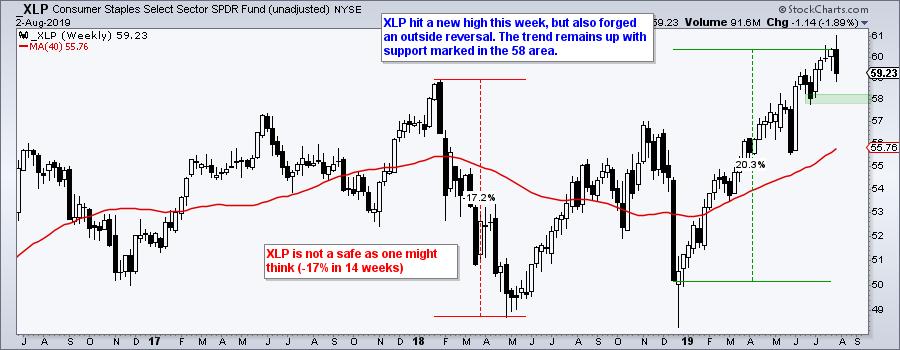
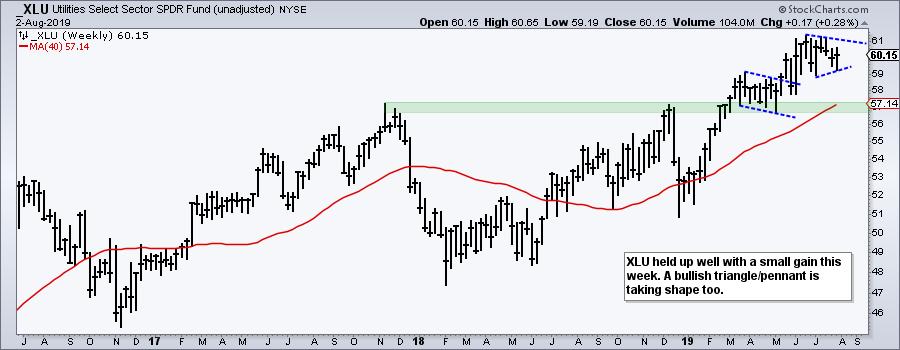
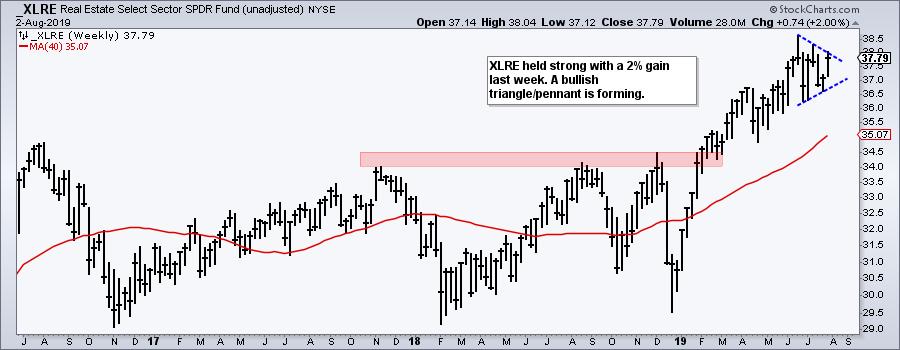
REITs and Utes Buck the Selling Pressure
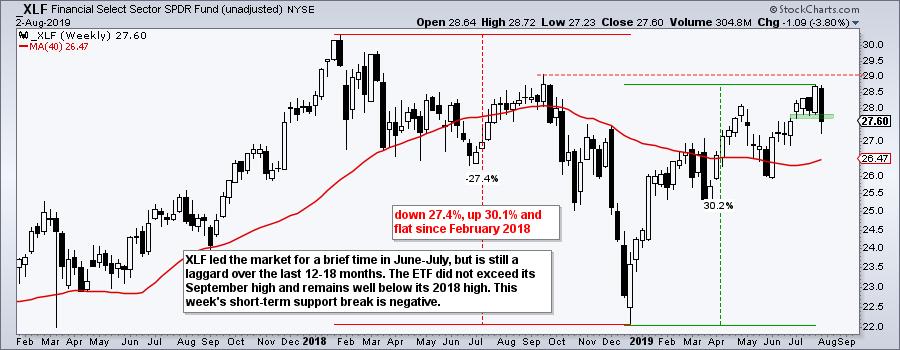
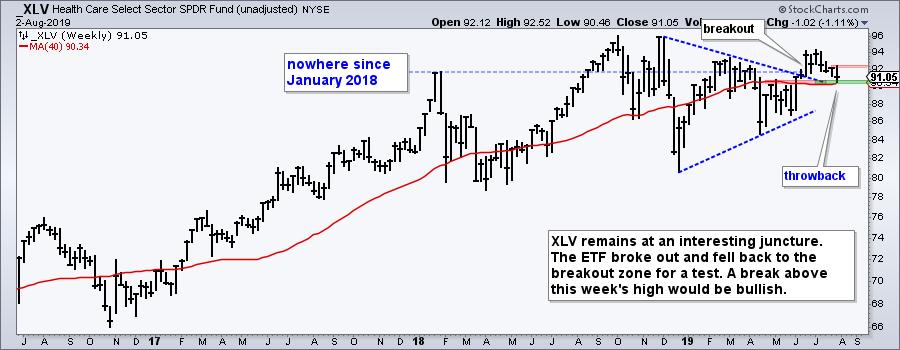
Now let's check in on some of the key sector charts.

------------------------------------------------------------
Bottom Line
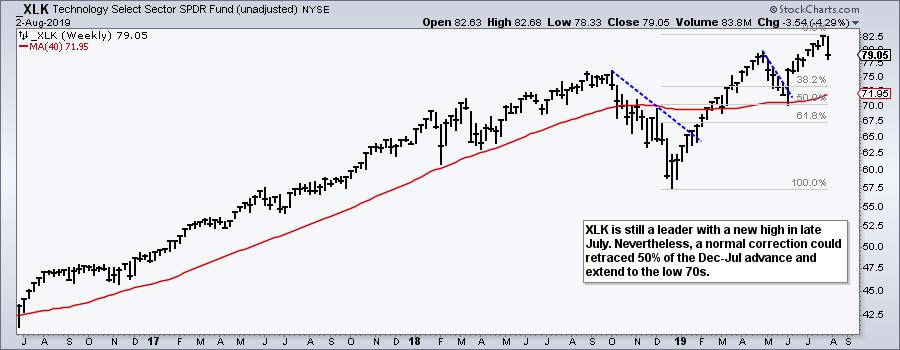
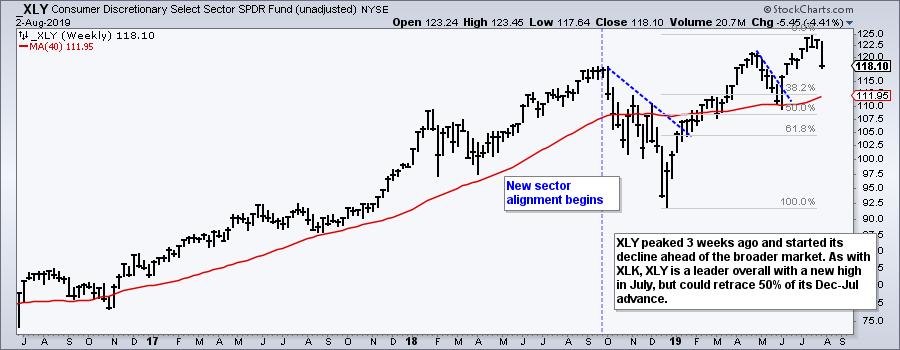
The S&P 500 SPDR remains in bull mode overall, but we are starting to see some hair-line cracks. Namely, the bearish breadth thrusts in XLK, XLI and XLC, and the short-term support breaks in SPY, IWM and XLI. SPY and the leading offensive sectors, XLK and XLY, are also ripe for a corrective period, which could involve a pullback or choppy range. I have not seen enough bearish evidence to say we are now in a bear market environment. The breadth tables are still net bullish and the 20-day SMA remains above the 200-day SMA for the S&P 500.
Follow me on twitter: @arthurhillEmail comments: arthurh@stockcharts.com
State of Stock Market Video
This week's video was produced on Thursday and featured in On Trend. Topics covered include:
- Quantifying Selling Pressure
- Weekly Charts for SPY, QQQ, MDY and IWM
- Breadth and Sector Table Update
- Gold, Bonds, Dollar and Oil
------------------------------------------------------------
Choose a Strategy, Develop a Plan and Follow a Process
Arthur Hill, CMT
Chief Technical Strategist, TrendInvestorPro.com
Author, Define the Trend and Trade the Trend
Want to stay up to date with Arthur's latest market insights?
– Follow @ArthurHill on Twitter


