 Watch for Rising Correlation
...The overall state of the stock market is the most important factor to consider when trading or investing in stocks. Broad market movements, by definition, affect most stocks. When the major stock indexes are trending lower, most stocks will also trend lower. Some will buck the downtrend, or perhaps hold up, but picking winners is a huge challenge when the broad market environment is negative. It's like fighting the tide.
Also note that correlation tends to rise when the broader market (S&P 500) declines, especially when it declines sharply. The chart below shows the 13-week Correlation Coefficient between SPY and five of the six biggest sectors. I am not showing the Communication Services SPDR (XLC) because of the sector re-alignment in July 2018 and the constituent overlap prior to this realignment. A correlation of 1 means the sector has perfect positive correlation to SPY (moves in same direction), while a correlation of -1 means it has perfect negative correlation (moves in opposite direction).
As expected, the Correlation Coefficients for Consumer Discretionary, Technology, Finance and Industrials are mostly positive and rarely dip into negative territory. Notice, however, how Correlation for Industrials and Healthcare dipped in April and then shot up in May as SPY declined. Even the "defensive" Healthcare sector was not immune to broad market weakness.
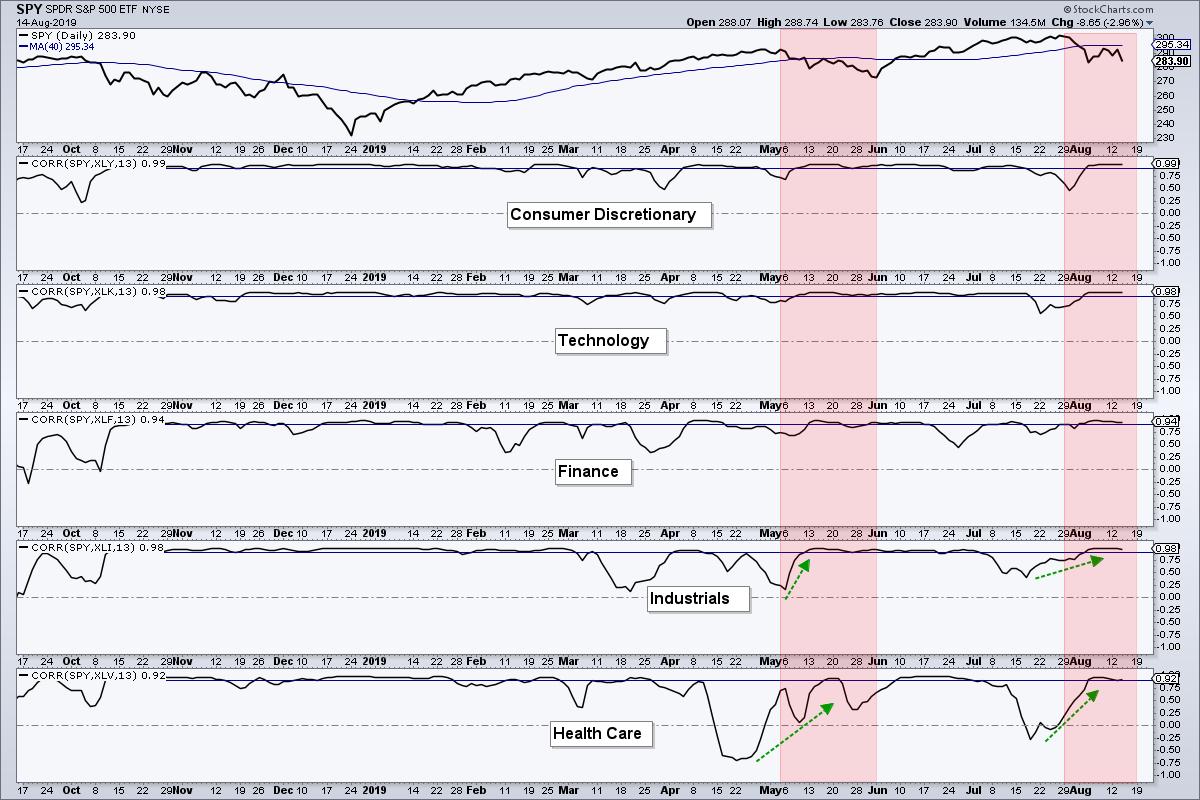
Currently, all five Correlation Coefficients are above .90 and this shows STRONG positive correlation with SPY. This is not a big surprise because the biggest stocks and sectors are the key drivers for the S&P 500. Notice how Correlation for Healthcare moved from below zero to above .90 in late July and early August. Healthcare is still not immune to broad market declines.
The next chart shows the other five sectors with the three defensive sectors at the top (Consumer Staples, Utilities and REITs). The red zones highlight the declines in December, May and August, while the green arrows show when the Correlation Coefficient moved sharply higher. Notice that the Correlation Coefficients for Staples, Utilities and REITs moved above .90 in late December. They were not immune when the S&P 500 fell sharply and investors through out the baby with the bath water. Utilities and REITs held up well in May and their Correlation Coefficients did not exceed .90. They are also holding up well right now and their Correlation Coefficients have yet to turn up.
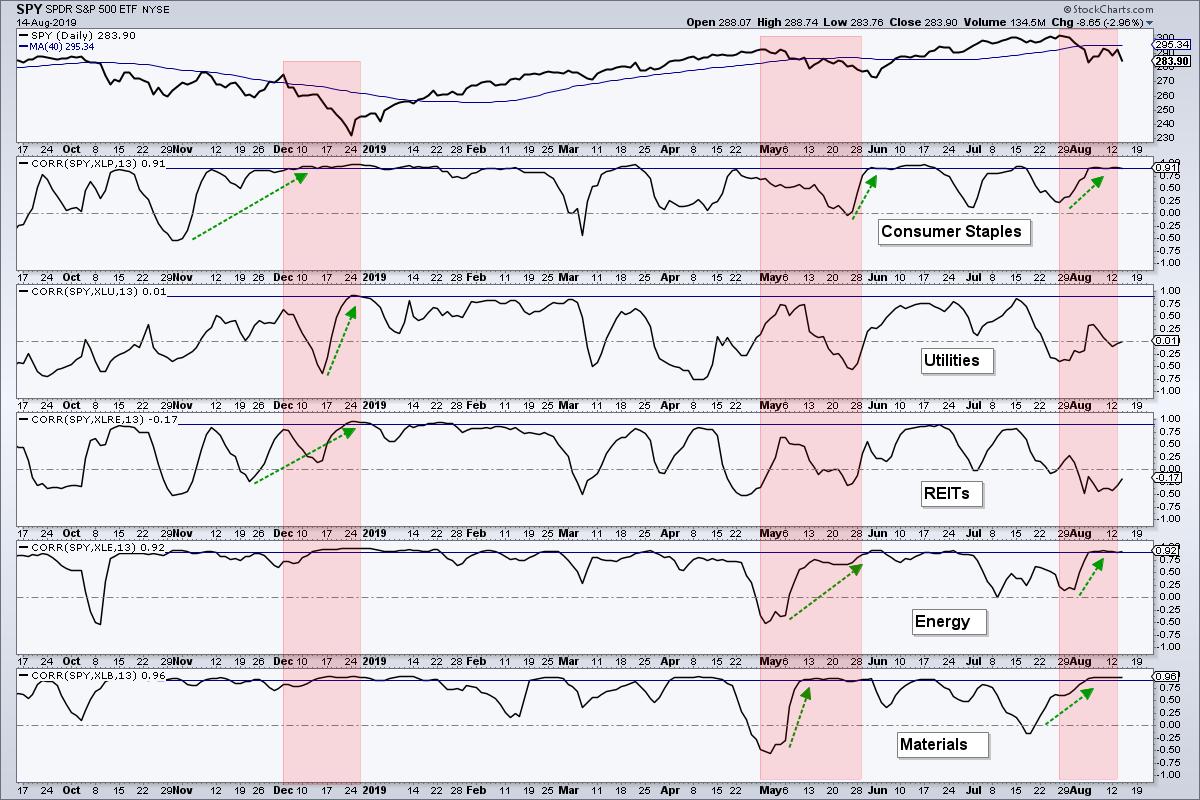
Even though Utilities, Staples and REITs are holding up now, I would expect these sectors to become more correlated to the S&P 500 if the broad market decline continues.
------------------------------------------------------------
Triple 80% Down Days
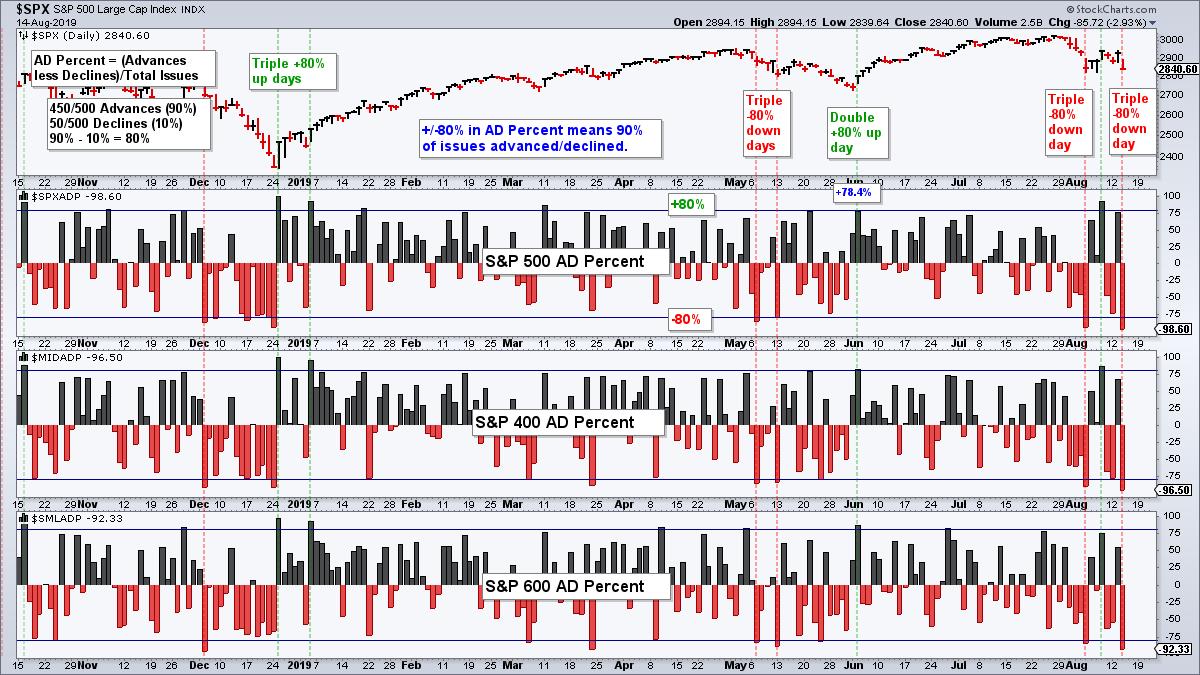
A triple -80% down day triggered in AD Percent for the second time in three weeks. As the formula example on the chart shows, an -80% down day means that 90+ percent of stocks in each index declined (S&P 500, S&P Mid-Cap 400 and S&P Small-Cap 600). This shows broad downside participation, and is negative, but this breadth thrust signal has two meanings. First, it signals a short-term oversold condition that could lead to a mean-reversion bounce (1-3 days). Second, it signals broad downside participation (bearish breadth thrust) that could lead to an extended decline (a few weeks to a few months). Notice the two triple 80% down days in May. The market bounced after the second signal with a three day advance, and then moved lower the next two weeks.
The next chart shows Up/Down Volume% for the same three indexes ($SPX, $MID, $SML). I prefer these indexes for my breadth indicators because they include large-caps, mid-caps and small-caps (1500 stocks), as well as Nasdaq (1/3) and NYSE (2/3) stocks. There were also two triple -80% down days over the last eight days. Also notice that S&P 500 AD Volume Percent ($SPXUDP) was the only one to exceed +80% between these two bearish signals (green arrow). In other words, we did not see a double or triple +80% up day on last week's rebound. This shows strong selling pressure on both declines (triple -80% down days) and weak buying pressure on the intermittent rebound (only one +80% up reading).
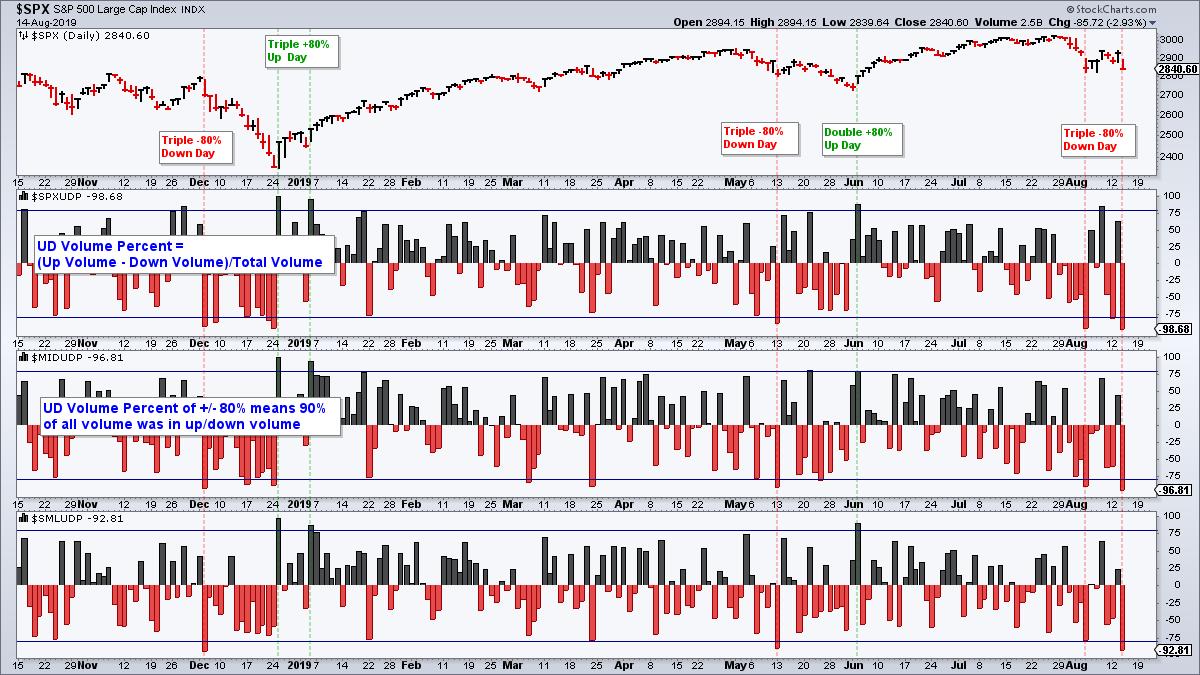
Overall, I view the two triple -80% down days as bearish signals until proven otherwise with a double or triple +80% up day.
------------------------------------------------------------
New Bearish Signal Tilts Index Breadth Model
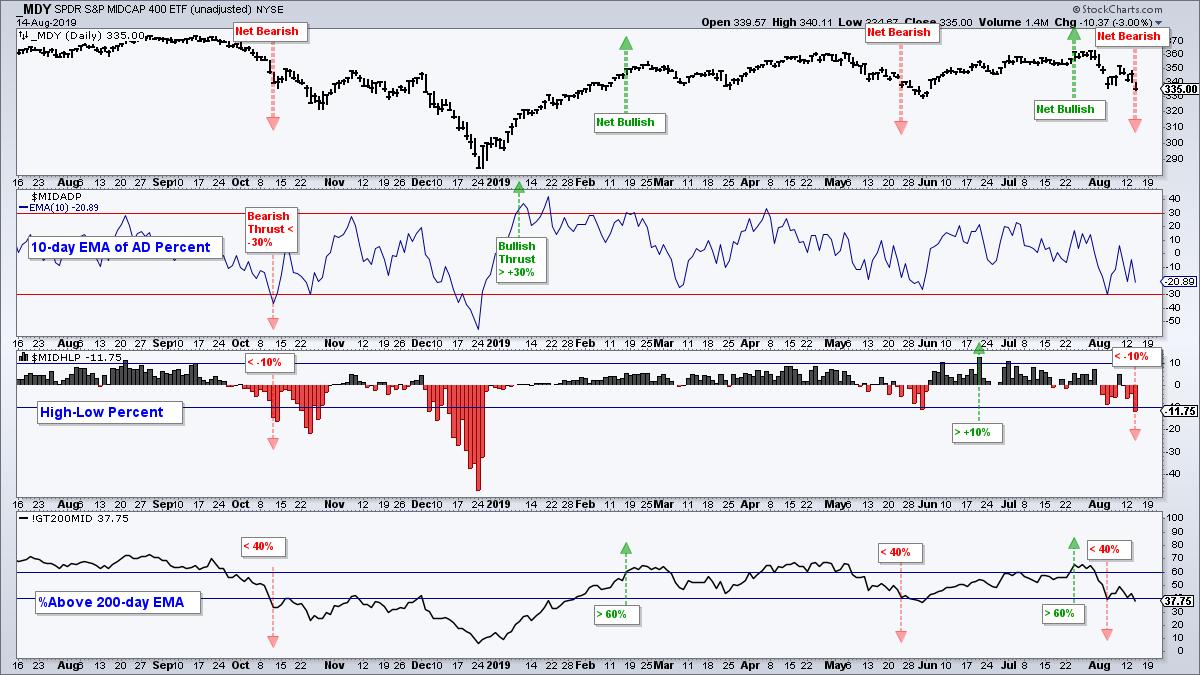
The index breadth model turned net bearish and this reverses the bullish signal from February 15th. Five of the nine indicators were on active bullish signals last week, but S&P 400 High-Low% ($MIDHLP) flipped this week and five of nine indicators are on active bearish signals. Technically, the S&P 500 is still net bullish with two of three active bullish signals. The S&P Mid-Cap 400 is now net bearish and the S&P Small-Cap 600 has been net bearish since March 22nd.

The chart below shows Mid-Cap %Above 200-day EMA (!GT200MID) moving below 40% in early August for a bearish signal and S&P 400 High-Low% ($MIDHLP) moving below -10% on Wednesday for a bearish signal.
------------------------------------------------------------
Sector Breadth Model takes a Big Hit
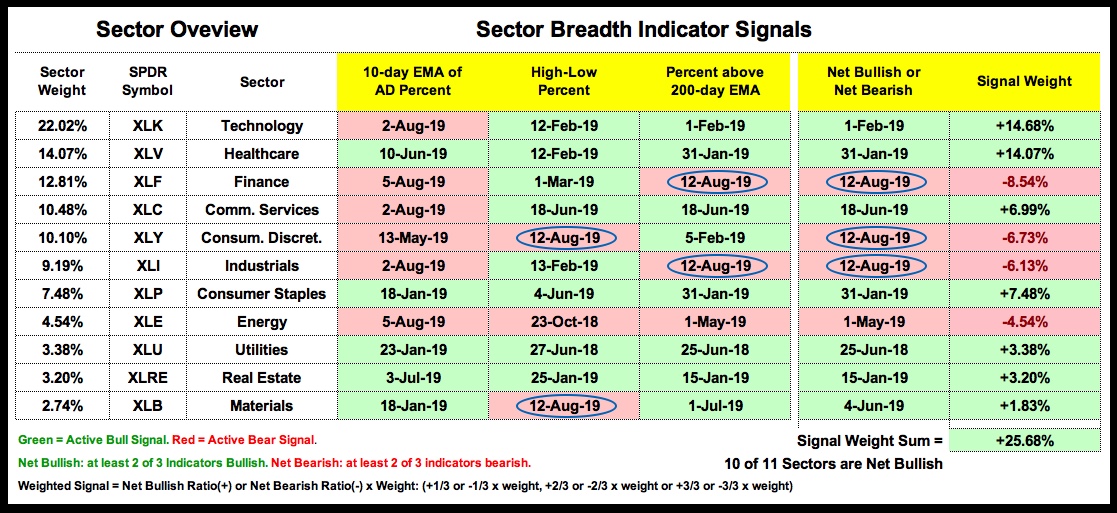
There were four new bearish signals on the sector breadth model and two key sectors flipped from bullish to bearish. High-Low Percent triggered bearish for Consumer Discretionary and Materials, while %Above 200-day EMA triggered bearish for Finance and Industrials. With these new signals, the Consumer Discretionary, Finance and Industrials sectors are net bearish with two (of three) active bearish signals. These are key sectors and part of the big six, the six biggest sectors that account for 78% of the S&P 500. They are also offensive sectors and this means three of the five offensive sectors are net bearish. The other two, Technology and Communication Services, are still bullish. Even though the sum of the signal weight is positive (+25.68%), the S&P 500 is clearly split with some serious pockets of weakness.
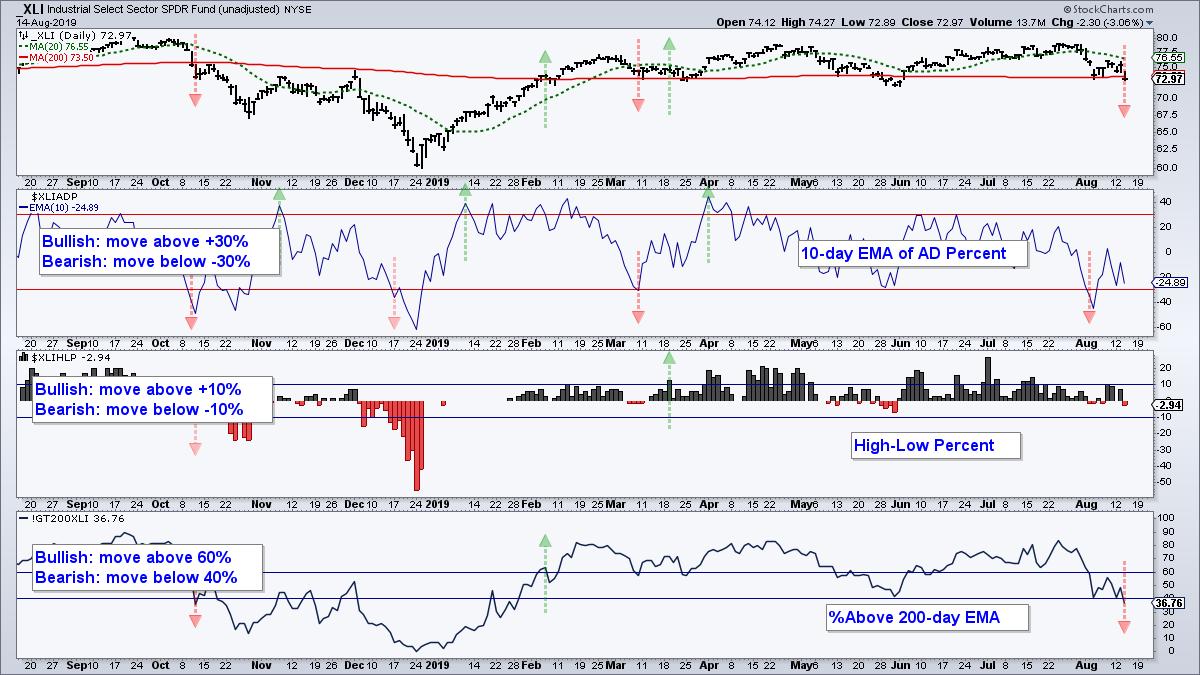
The chart below shows the Industrials SPDR (XLI) closing below its 200-day SMA. The 10-day EMA of Industrials AD% ($XLIADP) triggered bearish in early August and Industrials %Above 200-day EMA (!GT200XLI) triggered bearish on Wednesday (red arrows). Thus, two of the three indicators (majority) are on active bearish signals and this reverses the bullish signal from mid March.
------------------------------------------------------------
Bottom Line: Bear Market Environment
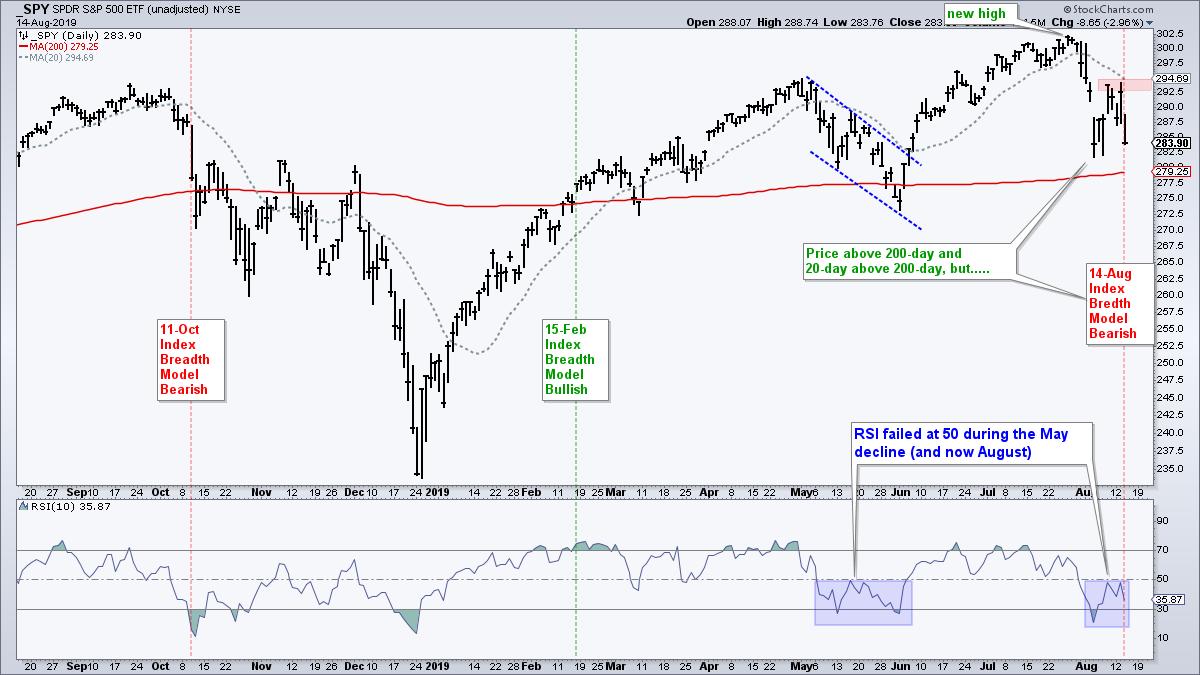
Even though the S&P 500 SPDR is above its rising 200-day SMA and the 20-day SMA is above the 200-day SMA, the weight of the evidence has shifted in favor of the bears. The index breadth model is net bearish and the sector breadth model is mixed, at best. I cannot be bullish on the broader market when the Finance, Industrials and Consumer Discretionary sectors are net bearish.
Playing the long side of the market in this environment is an uphill battle because the broad market environment has shifted. Even though Utilities, REITs and Staples are holding up better, these sectors are not without risk, especially in a bear market environment. Sometimes it is better to move aside and wait for the dust to settle. We must weigh potential risk against potential reward and right now I think risk outweighs reward.
Even though I labeled this a "bear market environment", I have no idea how long such an environment will last or how far a decline might extend for the S&P 500. It could be a few weeks or several months. It could be a few percent or a double digit decline. Nobody knows! As Charles Dow noted 100 years ago, neither the length nor the duration can be forecast. The best we can do is identify the trend/environment and trade/invest accordingly. Moreover, the trend/environment will remain in force until proven otherwise.
------------------------------------------------------------
Breadth Model Trumps Price Chart
This is about the only time you will hear me say that something is more important than price. While SPY is still technically in an uptrend, I defer to the index breadth model for my overall market stance. Notice that the model turned bearish on October 11th, a day before the index closed below the 200-day SMA and a few weeks before the 20-day moved below the 200-day. The model turned bullish on February 15th, but price was already above the 200-day SMA. However, the 20-day SMA was still below the 200-day SMA. We have to take a stance at some point and the breadth model is dictating my stance (bearish). The indicator window shows RSI(10) failing near the 50 level in mid May and again here in mid August.
------------------------------------------------------------
Art's Charts ChartList Update
The Art's Charts ChartList has been updated with a selection of breadth charts. Sorry, but I am not going to provide a list of bullish stocks when the broad market environment is bearish. Click here for the Art's Charts ChartList
------------------------------------------------------------
Choose a Strategy, Develop a Plan and Follow a Process
Arthur Hill, CMT
Chief Technical Strategist, TrendInvestorPro.com
Author, Define the Trend and Trade the Trend
Want to stay up to date with Arthur's latest market insights?
– Follow @ArthurHill on Twitter


