Sector Breadth Model Takes another Hit
Today I will rank and analyze the charts for the eleven sector SPDRs, but I will first cover the sector breadth table, which reflects the internal strength/weakness within each sector. Sometimes there is a discrepancy between the sector SPDR chart and the breadth signals. The breadth indicators put the component stocks on equal footing, but the sector SPDRs are weighted by market cap. The breadth signals tell us how the "average" stock in the sector is performing, while the SPDR charts reflect large-cap performance. Sometimes breadth and chart signals are in sync and sometimes they are not.
The sector breadth model took two more hits this week and is close to turning negative. Communications Services High-Low% ($XLCHLP) dipped below -10% and the Consumer Discretionary %Above 200-day EMA (!GT200XLY) moved below 40%. This means four of the six biggest sectors are net bearish. Only Healthcare and Technology remain net bullish. The sum of the weighted signals moved below 10% and is perilously close to turning negative.
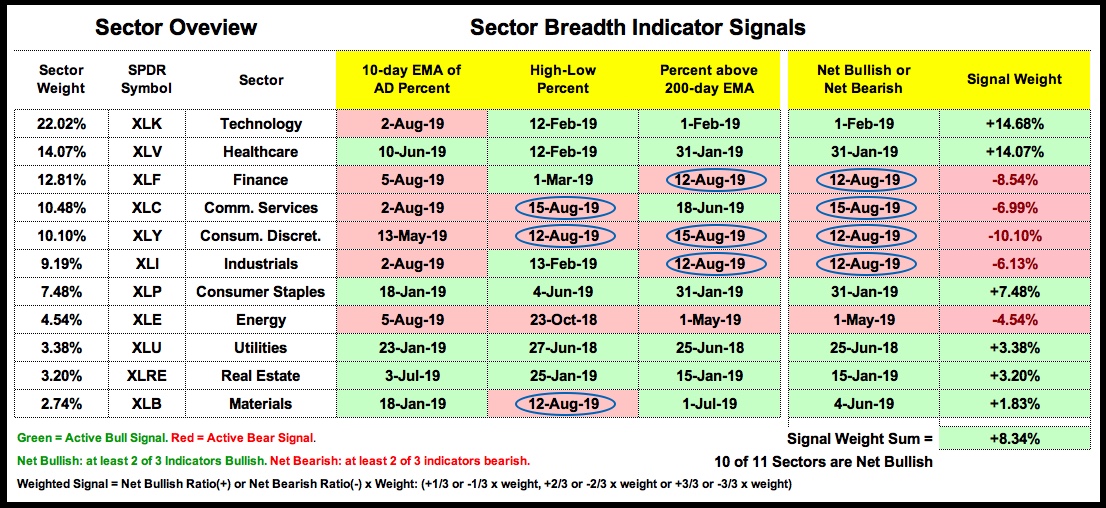
Keep in mind that the weighted sum ranges from -100% to +100% with 0% in the middle. Even though the sum is still positive (+8.34%), readings near zero reflect a split market at best. I cannot be bullish on stocks with four of the six biggest sectors net bearish and four of the five offensive sectors net bearish.
------------------------------------------------------------


------------------------------------------------------------
Utes, REITs and Staples Hold Strong
The next sections will rank the sectors based on the price charts. Utilities, REITs and Staples are the clear leaders in the top group. XLK, XLY and XLC form the second group because they hit new highs in July and remain well above their early June lows. XLV and XLB are somewhere in between: not leading and not lagging. XLI, XLF and XLE are the weakest of the eleven.
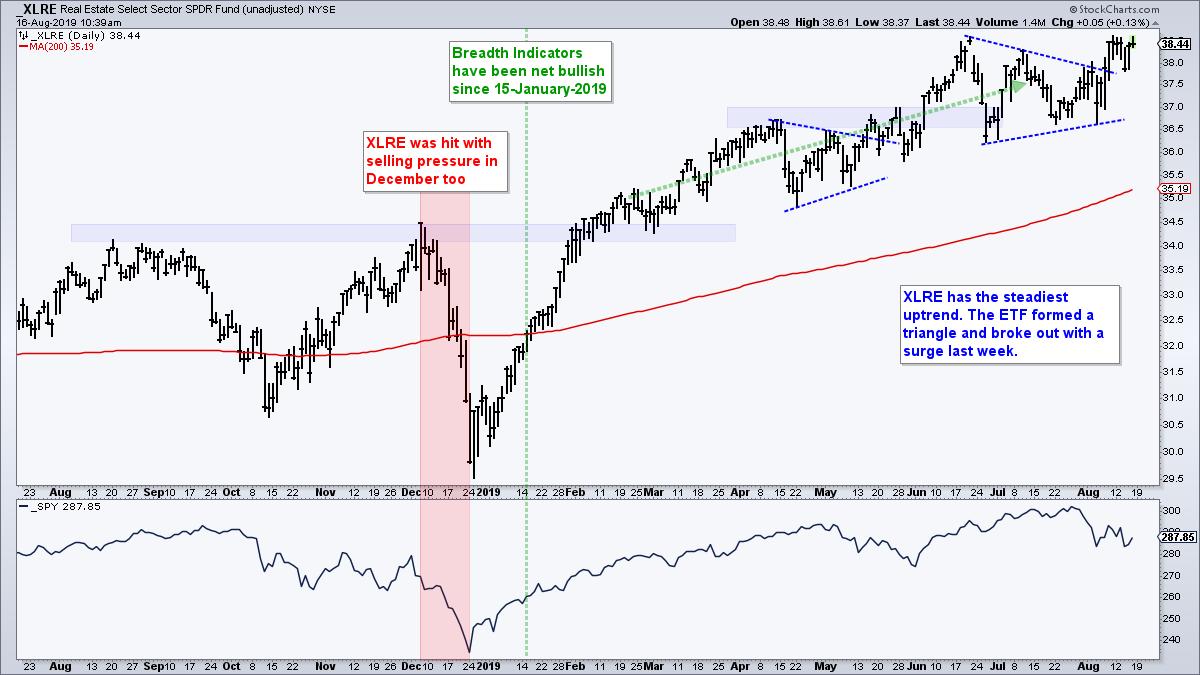
The Real Estate SPDR (XLRE) broke out of a triangle consolidation last week and is close to a new high. The breakout signals a continuation of the bigger uptrend. Not many industry group ETFs or stocks broke out last week, which makes XLRE a clear leader. The July lows mark first support in the 36.5 area.
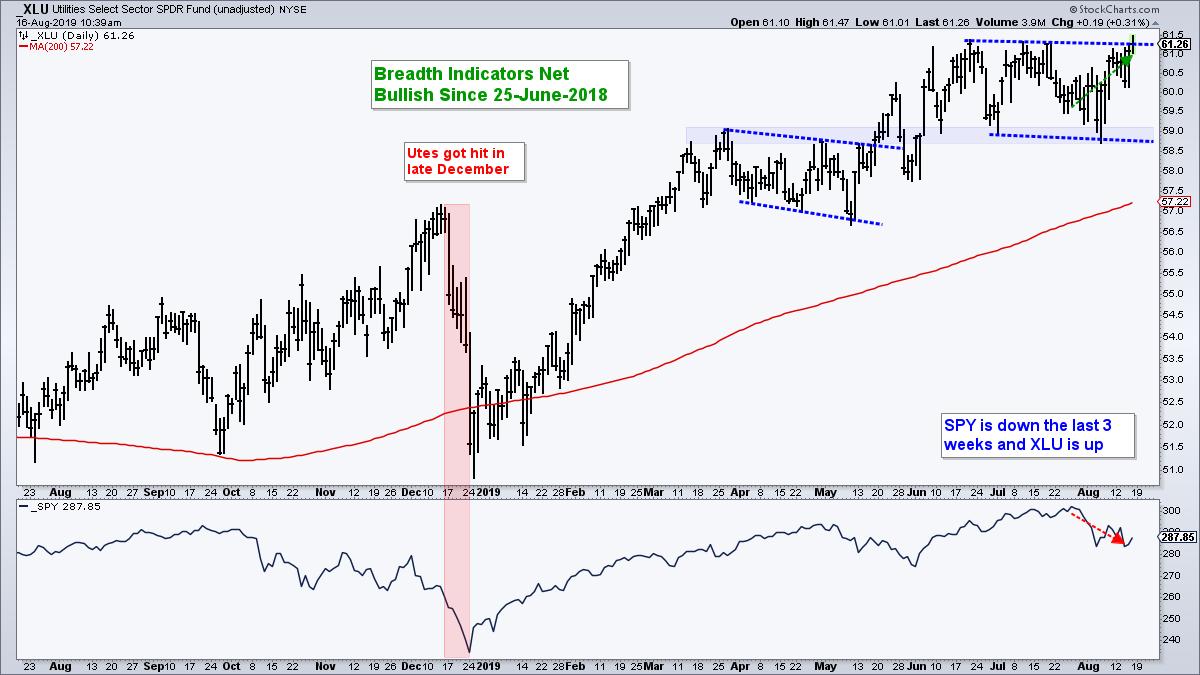
The Utilities SPDR (XLU) held up over the last three weeks and is trading back near its June-July highs. XLU is up around 2.2% the last three weeks and SPY is down around 5%. Overall, the ETF is consolidating above the breakout zone (blue) and this looks like a consolidation within an uptrend. A close below the support zone (58.5) would call for a re-evaluation.
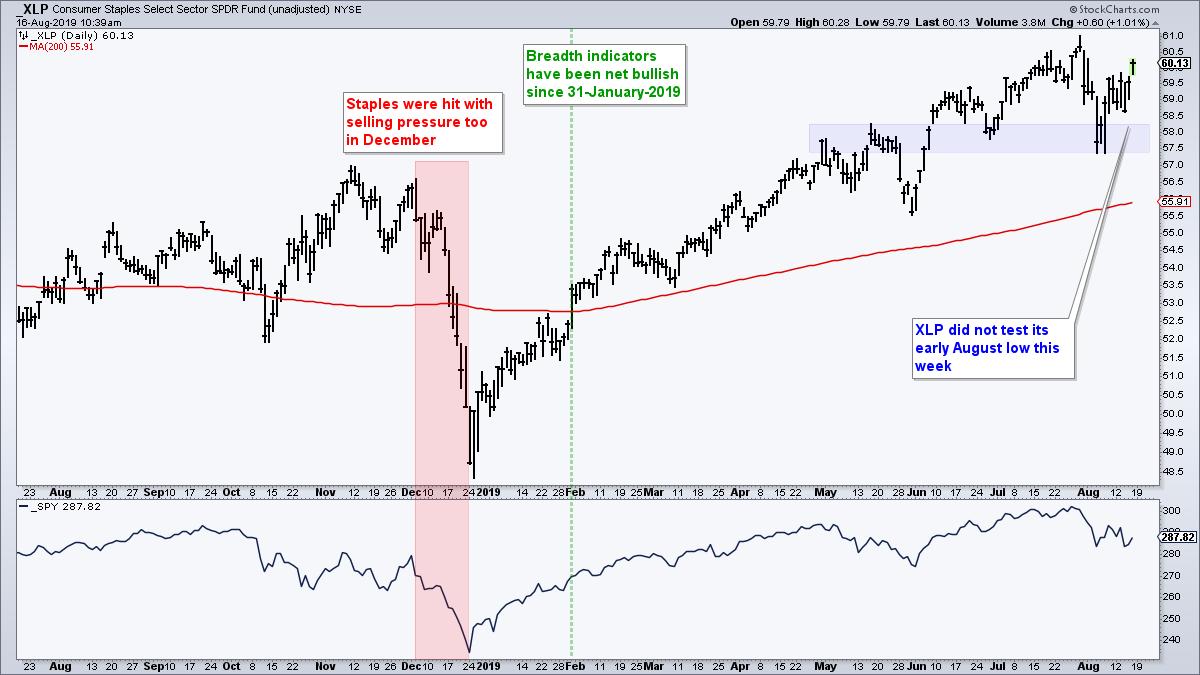
The Consumer Staples SPDR (XLP) is also holding up over the last few weeks. XLP was hit hard in early August, but bounced and did not test the early August low this week. The breadth indicators have been net bullish since January 31st. On the price chart, the July-August lows combine to mark a support zone in the 57.5-58 area.
------------------------------------------------------------
XLK, XLC and XLY Firm Near Key Retracements
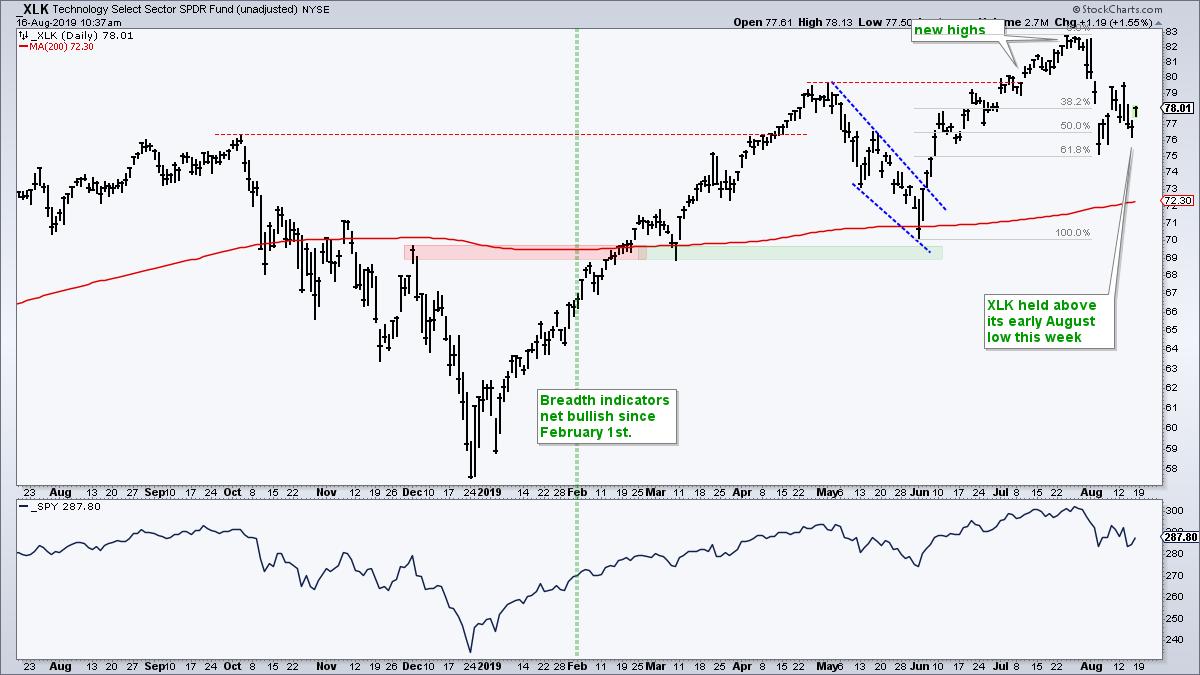
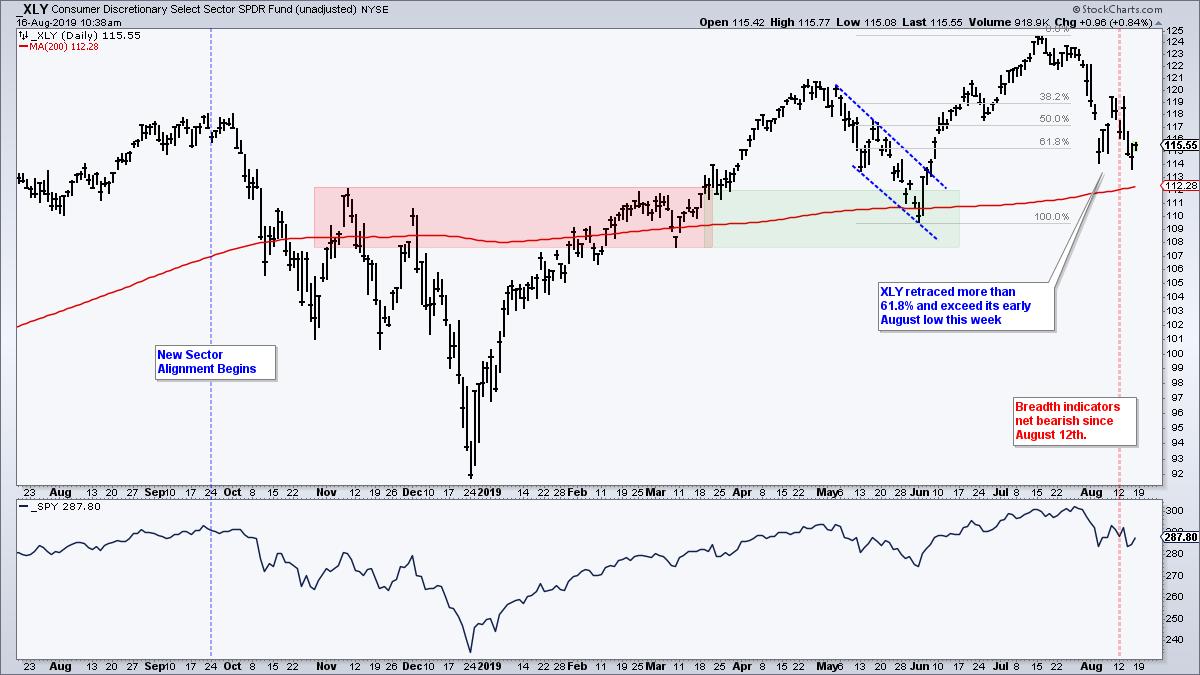
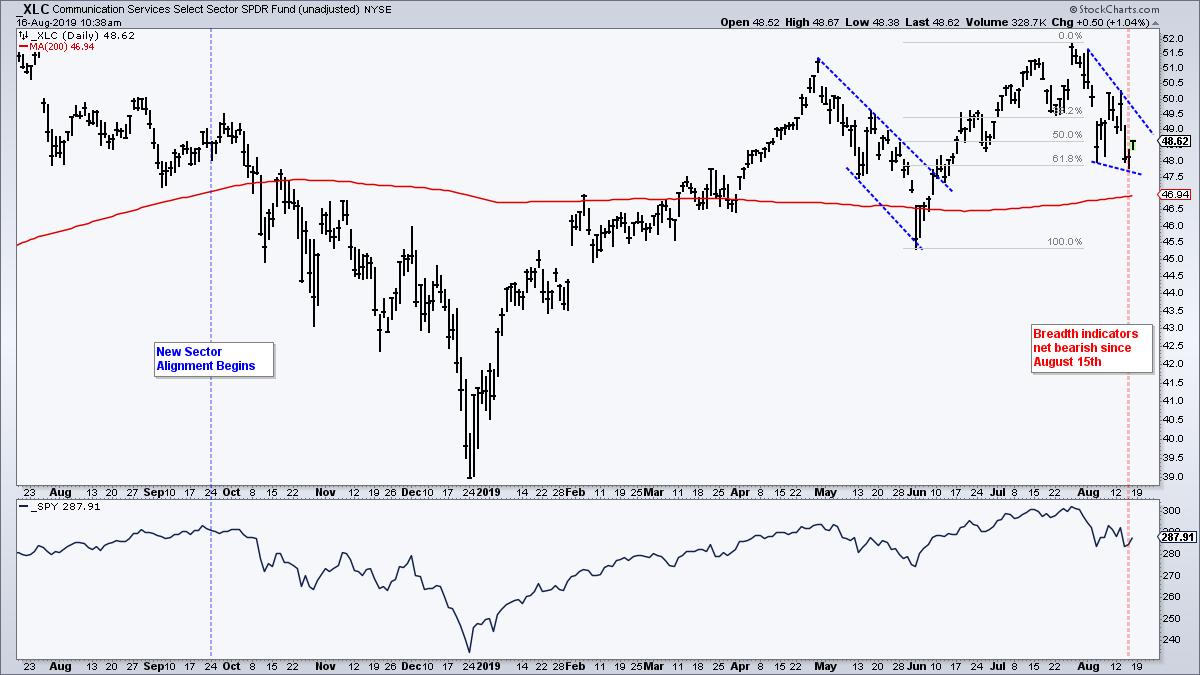
The next three sectors have big weightings in the S&P 500 and many key stocks. XLK accounts for 22% with Apple, Microsoft, Visa, Mastercard, Intel and Cisco. XLC accounts for 10.5% with Google and Facebook. XLY accounts for 10.1% with Amazon, Home Depot McDonalds and Starbucks. All three sector charts are similar with new highs in July and sharp pullbacks in August. These pullbacks retraced around 61.8% of the prior declines and remain well above the early June lows. Even though the charts do not look so bad, two of the three breadth indicators are bearish for XLC and all three are bearish for XLY.
I am putting the Technology SPDR (XLK) in fourth place because it still has a decent looking chart and the breadth indicators are net bullish. The ETF hit new highs in July and then retraced 61.8% of its June-July surge with the decline back to 75. XLK was hit with the rest of the market this week, but held above the early August low and showed relative strength.
The Consumer Discretionary SPDR (XLY) has performed well because its top four holdings, Amazon, McDonalds, Home Depot and Starbucks, hit new highs in July and are up 18 to 50 percent year-to-date. XLY is a little weaker than XLK because it exceeded its 61.8% retracement on the early August decline and formed a lower low from early to mid August. Nevertheless, the ETF did hit a new high in July and remains well above the May low.
The Communication Services SPDR (XLC) is also trying to firm near the 61.8% retracement and early August low. A falling wedge formed the last few weeks and the immediate trend is down as long as this wedge falls. A breakout at 49.5 is needed to reverse the wedge.
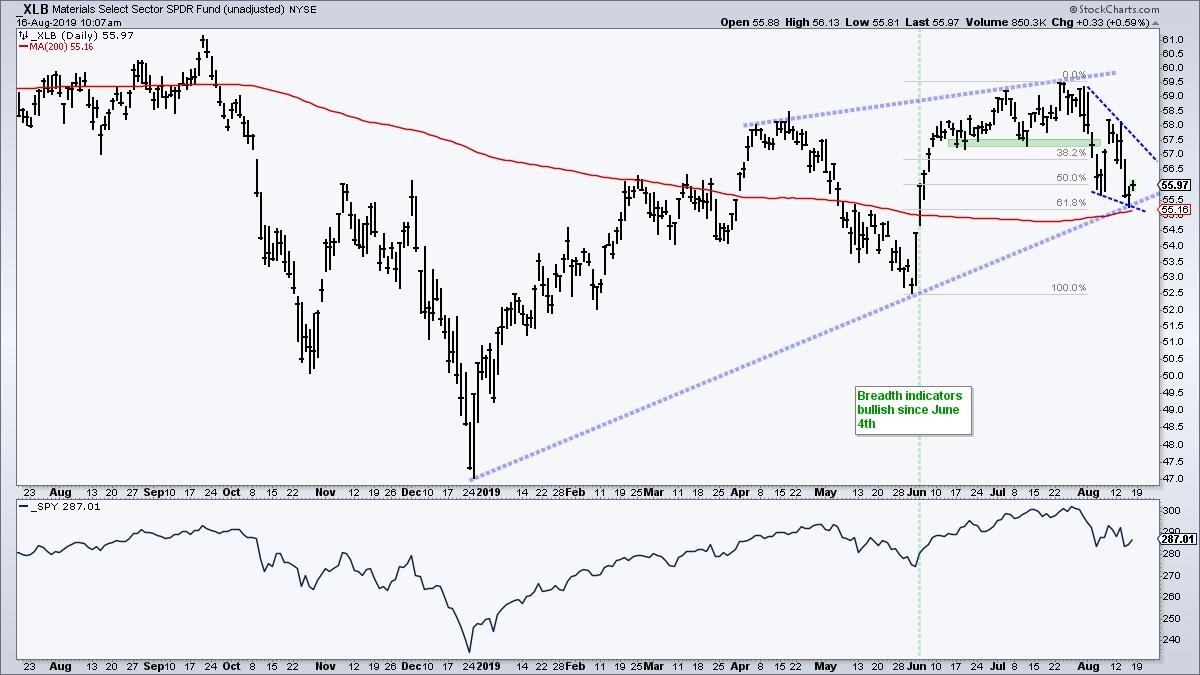
The Materials SPDR (XLB) gets seventh place because it forged a higher high from April to July and remains above its early June low. It is not grouped with XLK, XLY and XLC because it did not record a 52-week high in July. Thus, it is one step down. XLB is also trying to firm near the 61.8% retracement with a falling wedge taking shape.
------------------------------------------------------------
Healthcare is Seriously Confused
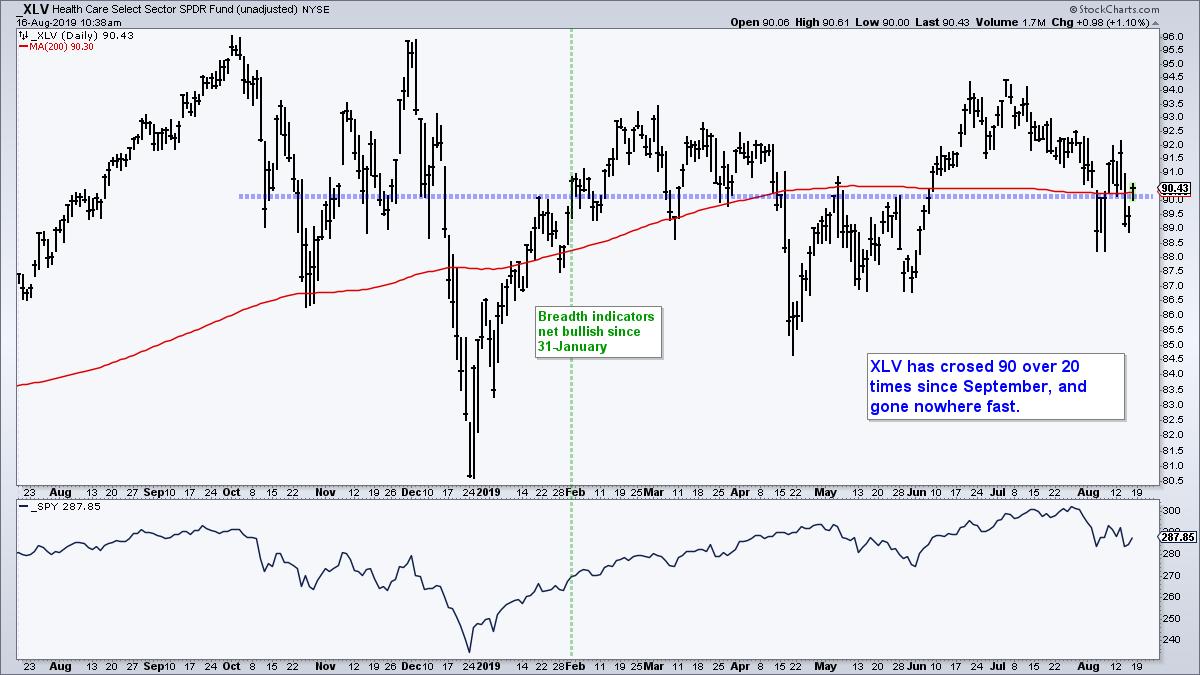
I am putting the Health Care SPDR (XLV) in eighth place on the sector SPDR rankings. All three breadth indicators are on bullish signals and these indicators have been net bullish since January 31st, but XLV is one confused soul on the price chart. I cannot make heads or tails of this chart, except for the fact that it remains in a choppy trading range. I give the bulls the edge based on breadth.
------------------------------------------------------------
XLF, XLI and XLE are the Weakest Links
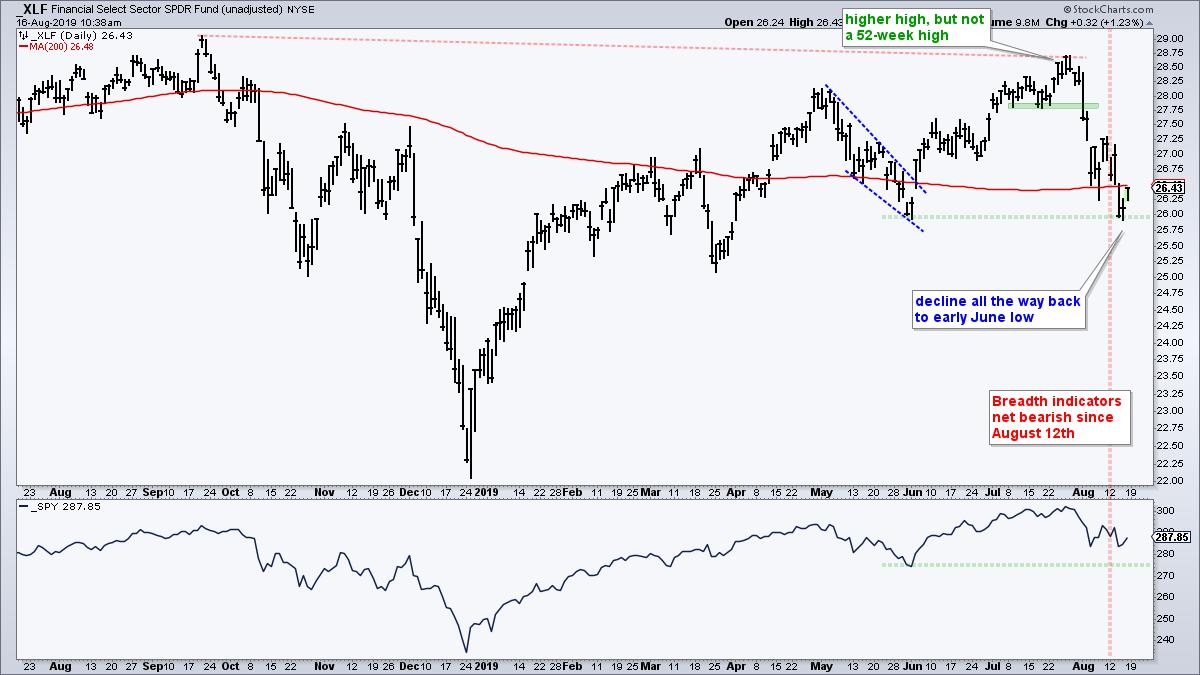
The Financials SPDR (XLF) started to outperform in July, but gave it all back with a decline back to the early June low. The ETF did not hit a 52-week high in July and the depth of the decline showed relative weakness here in August. Perhaps there is support from this early June low. The combination of a weak chart and bearish breadth indicators suggest that this low will not hold.
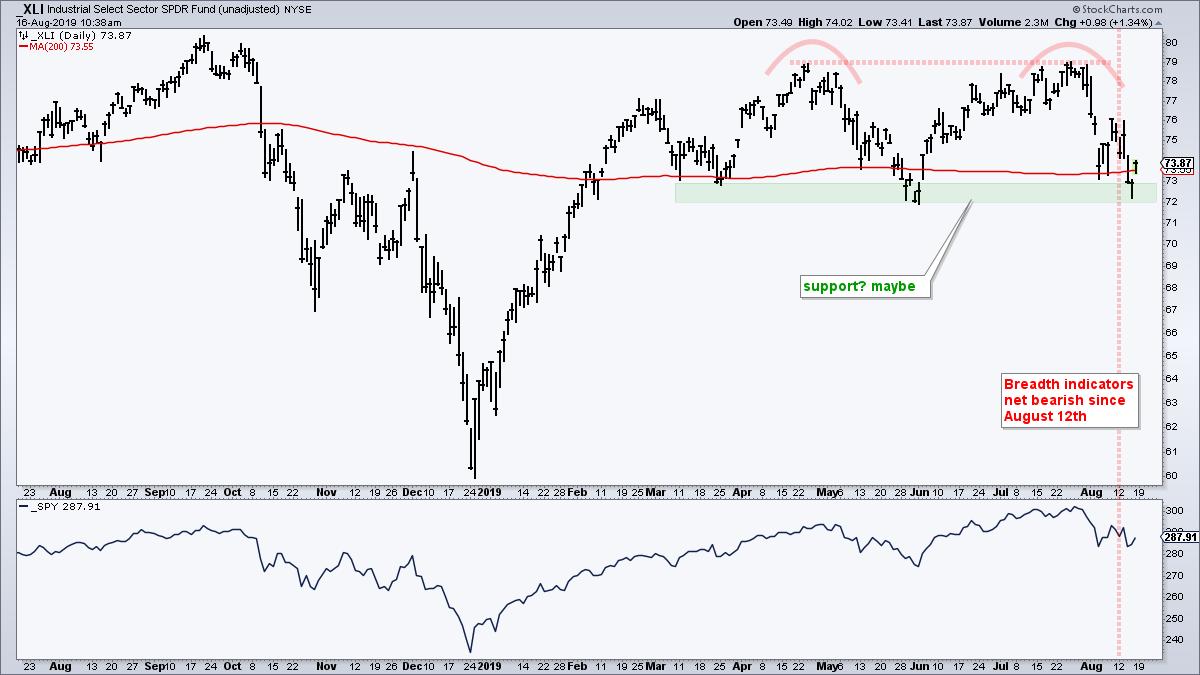
The Industrials SPDR (XLI) also returned to the early June low here in August and led on the decline. In addition, XLI did not clear the April high and did not hit a 52-week low. There may be support in the 72-73 area, but the breadth indicators are net bearish and XLI is underperforming on the charts. This leads me to believe XLI will break the early June low.
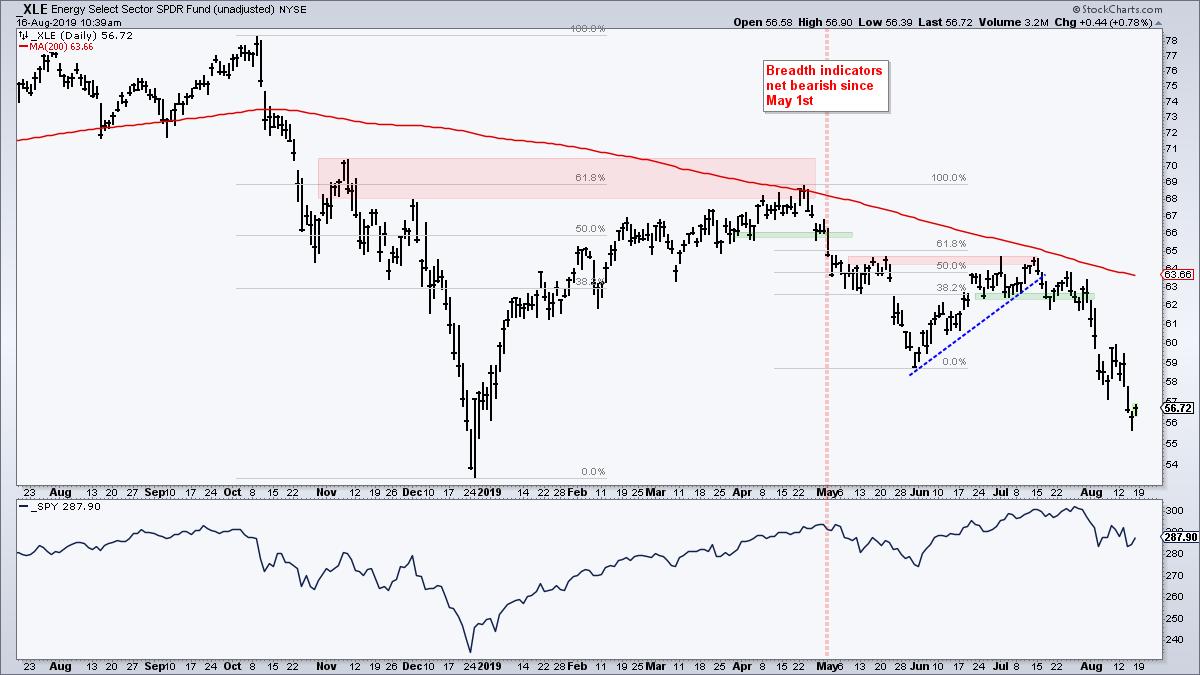
The Energy SPDR (XLE) is by far the weakest sector and the breadth indicators have been net bearish since May 1st. XLE reversed in the 64-65 area after hitting the 50-61.8% retracement zone and resistance from the mid May high. The break down in late July pushed the ETF to its lowest level since early January.
------------------------------------------------------------
Bottom Line
There is not a lot of choice right now. Utilities, REITs and Staples are the only sector SPDRs with strong charts and bullish breadth. XLK, XLY and XLC fell rather hard in August, but these declines started from 52-week highs and they retraced around two thirds of the prior advance. These three are holding up for now, but bearish breadth indicators in XLY and XLC keep me away. XLK looks the best of the three. XLV is all mixed up with nowhere to go. XLF and XLI returned to their early June lows. Even though they have yet to break these lows, they show some serious chart underperformance and their breadth indicators are net bearish.
------------------------------------------------------------
Choose a Strategy, Develop a Plan and Follow a Process
Arthur Hill, CMT
Chief Technical Strategist, TrendInvestorPro.com
Author, Define the Trend and Trade the Trend
Want to stay up to date with Arthur's latest market insights?
– Follow @ArthurHill on Twitter


