
Even though trend continuations are more likely than trend reversals, reversals do occur and chartists looking for price reversals should understand the classic patterns. While perusing through the charts today, I found a stock with a classic reversal pattern and a breakout in the works. Even though reversal patterns are featured in all the classic technical analysis books, note that these patterns are largely subjective and their success rates vary. I can show you plenty of successes, and plenty of failures.
Let's start with the theory behind today's pattern, the Double Bottom. Two troughs (lows) form in relatively equal areas with a peak (high) in between. The troughs show an area that attracted buying pressure and support formed. The peak shows an area that attracted selling pressure and resistance formed. Overall, the entire pattern represents a base where prices are moving sideways. A break above resistance shows a marked increase in buying pressure and this confirms the pattern. Traditionally, the height of the pattern is added to the breakout for an upside target.
Couple things to keep in mind. First, we rarely get an ideal pattern that exactly matches the theory. Second, Double Bottoms are supposed to be sizable "reversal" patterns. This means they should form after an extended decline, not after a garden variety pullback. Third, the pattern is NOT confirmed until a break above resistance, which means a higher high needs to form. Fourth, take targets with a healthy dose of skepticism. We must continually monitor price action for signs of strength or weakness. And finally, use other indicators to confirm.
Now let's look at a live example. The chart below shows Western Digital (WDC) with two troughs in the 35 area and a peak around 55. Notice that this double bottom extends from December to June, at least six months. Also notice that WDC hit a new low in December and was clearly in a downtrend before the pattern took shape. The six month trading range represents a big base and WDC is breaking out as I write.
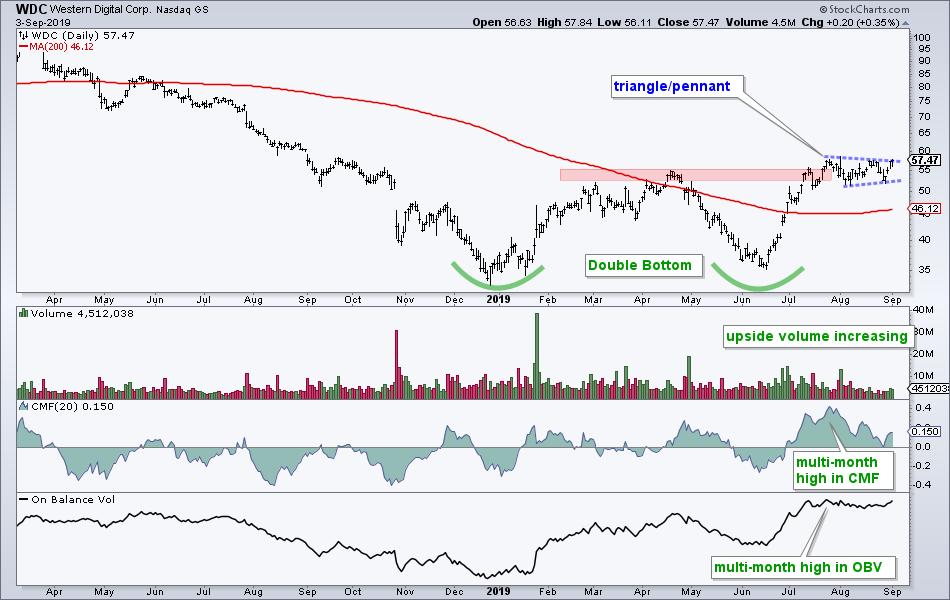
The indicator windows shows volume, Chaikin Money Flow (CMF) and On Balance Volume (OBV). Notice that upside volume appears to be outpacing downside volume during the basing process. This is confirmed with a rising OBV line and new high. Also notice that CMF hit a new high in July when price was breaking resistance.
Short-term, WCD consolidated with a pennant over the last four weeks. This makes sense because the S&P 500 also consolidated the last four weeks. This penant looks like a bullish continuation pattern and a breakout at 58 would argue for a continuation of the June-July advance. Such a move would also further solidify the Double Bottom breakout. Chartists can re-evaluate on a close below the August lows.
It can also help to check the charts for stocks in similar businesses. I always think of Seagate Technology (STX) when looking at WDC because they have similar businesses (hard drives and solid-state storage). STX also sports a bullish chart and is stronger because a significantly higher low formed from December to early June. The stock broke resistance with an advance from January to April and then formed a large Symmetrical Triangle. Prices broke out of the triangle with a surge in August as STX bucked the broader market by moving sharply higher.
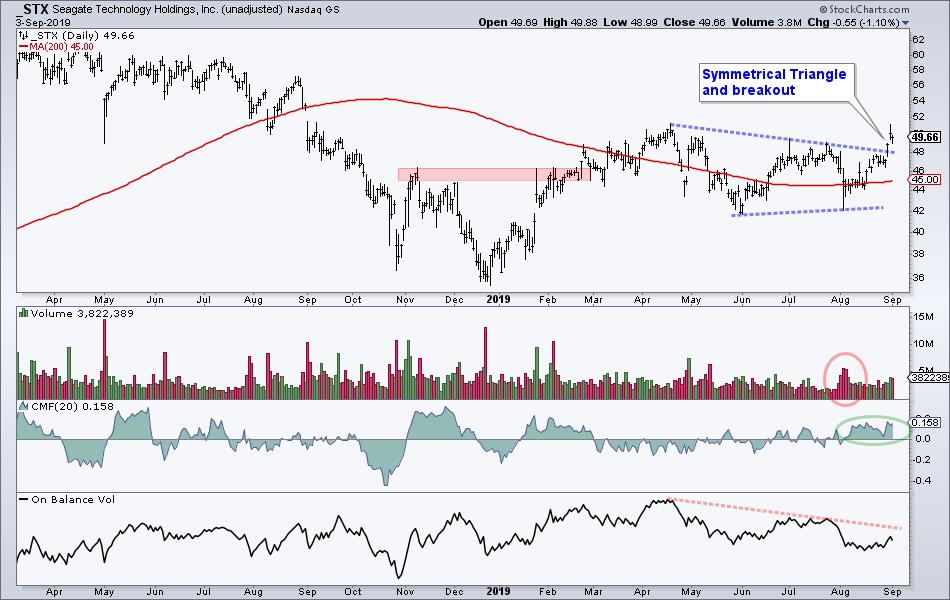
Volume aficionados will not be too happy with the volume trends though. Upside volume on the breakout was lower than in late July (red oval) and OBV trended lower from April to August. CMF, however, did turn positive in August and hit its highest levels since February. You can't have everything!
Personally, I focus on price-based indicators and do not use volume-based indicators very often. Yeah, yeah, I know, breakouts should be confirmed with volume. Blah blah blah. In reality, price is the ONLY thing that pays (h/t Brian Shannon of AlphaTrends.net). We do not make less money if prices advance on high volume and we do not lose less if prices fall on low volume. Price Rules!
------------------------------------------------------------
Elsewhere in Classical Charting
Choose a Strategy, Develop a Plan and Follow a Process
Arthur Hill, CMT
Chief Technical Strategist, TrendInvestorPro.com
Author, Define the Trend and Trade the Trend
Want to stay up to date with Arthur's latest market insights?
– Follow @ArthurHill on Twitter


