 Bullish continuation patterns are my favorite patterns when it comes to stocks and ETFs. As the name suggests, bullish continuation patterns, when confirmed, signal a continuation of the prior trend. Furthermore, because it is a "bullish" continuation, it means the prior trend was up and that trend is now continuing. With the S&P 500 spending some 73% of its time above the 200-day SMA over the last 20 years, it is much easier to make money on uptrends and bullish patterns than downtrends and bearish patterns.
Today's bullish continuation pattern is the Ascending Triangle. This is a classic pattern that forms with relatively equal highs marking overhead supply and higher lows marking demand points. The equal highs mark a resistance level where demand was not strong enough to overpower supply. The higher lows, however, show demand coming in at higher levels. In other words, the dips are becoming shallower as demand increases at higher prices. A break above resistance confirms the pattern because is signals a victory for demand.
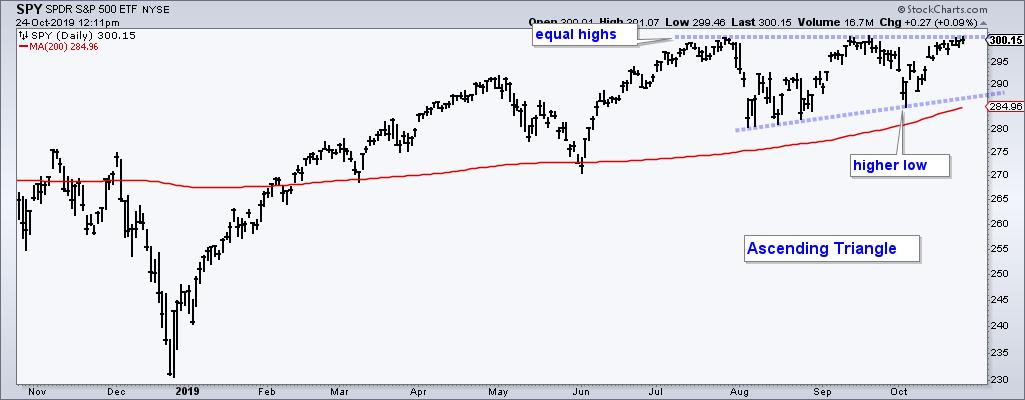
The chart above shows an Ascending Triangle taking shape in the S&P 500 SPDR (SPY) over the last three months. The higher low in October shows demand coming it at higher prices (above the August lows). The equal highs mark a zone of overhead supply in the 301 area. A break above this level would confirm the pattern and target a move to the 320 area. Note that the height of the pattern is added to the breakout level for an upside target (301 - 281 = 20, 301 + 20 = 321).
There are at least three more Ascending Triangles forming in some key ETFs. In addition, there are a number of bullish triangles and these patterns were highlighted in today's report at TrendInvestorPro.com. This report comes with a PDF ChartBook that features 60 ETFs ranked by chart performance.
Choose a Strategy, Develop a Plan and Follow a Process
Arthur Hill, CMT
Chief Technical Strategist, TrendInvestorPro.com
Author, Define the Trend and Trade the Trend
Want to stay up to date with Arthur's latest market insights?
– Follow @ArthurHill on Twitter


