
The Industrials SPDR (XLI) and Finance SPDR (XLF) are two of the big six sectors in the S&P 500 and both are moving in the right direction: up.
The Industrials sector accounts for 9.32% of the S&P 500, while the Finance sector accounts for 13.02%. They are important sectors because of their size and because of what they represent. The Industrials sector represents the manufacturing side of the economy, while the Finance sector represent the banking system. Both are key to broad strength in the economy and the S&P 500.
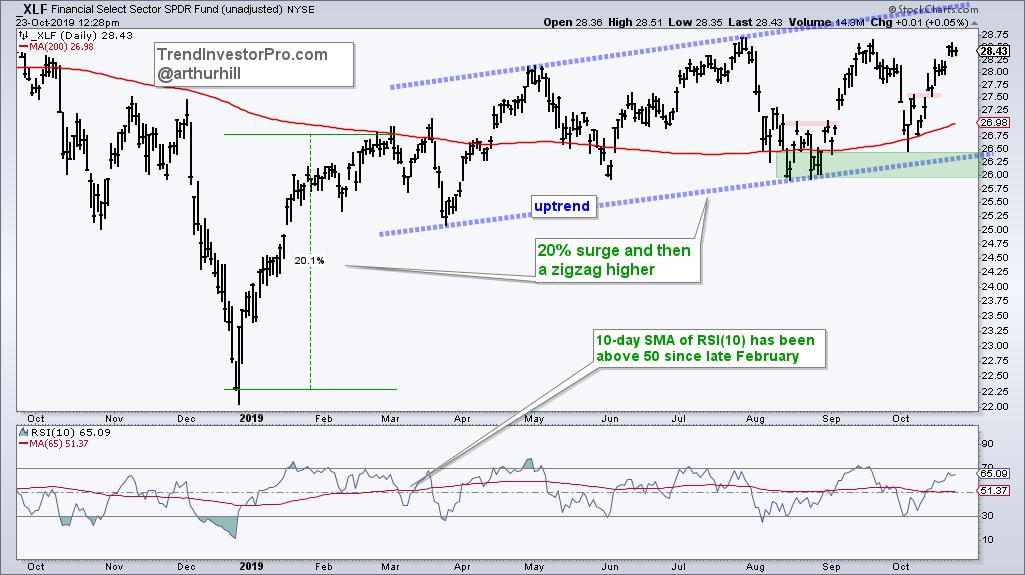
On the price charts, we can see both working their way higher since March. First, XLF surged some 20% from late December to late February. This was the rocket lifting off to start the uptrend. Prices have since moved higher in zigzag fashion with higher highs and higher lows. This, my friends, is what an uptrend is all about. Yes, I realize that XLF remains below its July high, but the blue channel lines are sloping up. Price is above the 200-day and this moving average is turning up.
The next chart shows XLI surging some 27% and then embarking on a zigzag higher. The ETF exceeded its spring high in September and has a series of higher lows over the last few months. The blue channel lines are not perfect, but they are sloping up and capturing this uptrend. In addition, price is above the 200-day SMA and the 200-day SMA turned up.
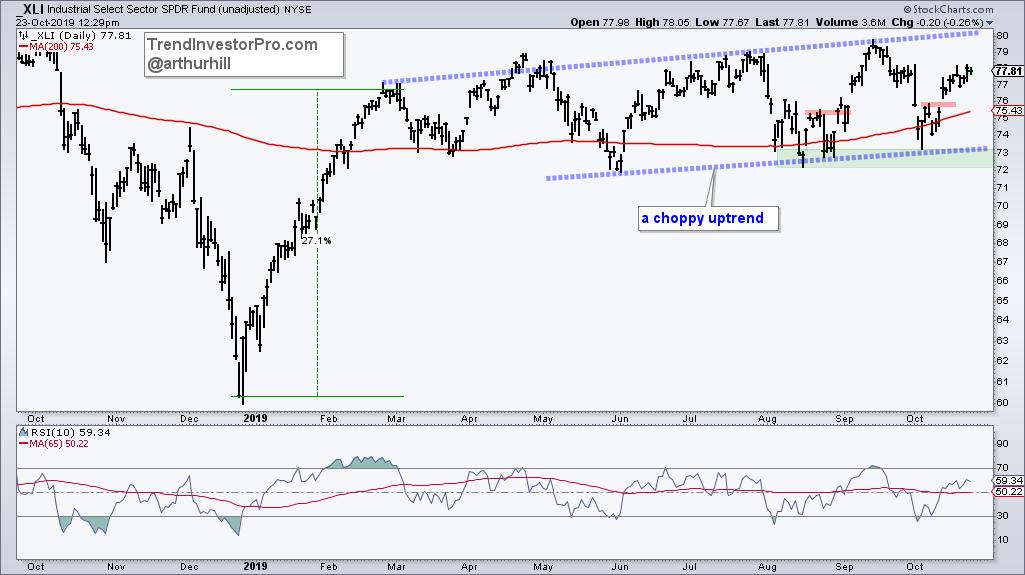
The short red horizontal lines mark short-term support levels, which were broken with the gap-surge off support on October 11th. These breakouts and gaps up held, and the bigger trend is up. I, therefore, would expect higher highs from both in the coming days and weeks. A close below gap zones from October 11th (October 10th close) would call for a re-evaluation.
TrendInvestorPro.com Launch
I will still contribute content to StockCharts on a limited basis, but the vast majority of my content will now be on TrendInvestorPro.com, which just opened up for subscriptions today. Here's a look at the offering:
- ETF Ranking and Grouping with Analysis (Thursdays)
- ETF ChartBook featuring 60 annotated charts (Thursdays)
- The State of the Stock Market Report (Fridays)
- Stock setups and chart analysis (Saturdays)
- Weekly video analysis and education
I am offering an introductory rate of $29 per month. Note that I expect to raise the monthly subscription rate early next year when detailed strategies and educational videos are added to the mix. Hope to see you there!
Choose a Strategy, Develop a Plan and Follow a Process
Arthur Hill, CMT
Chief Technical Strategist, TrendInvestorPro.com
Author, Define the Trend and Trade the Trend
Want to stay up to date with Arthur's latest market insights?
– Follow @ArthurHill on Twitter


