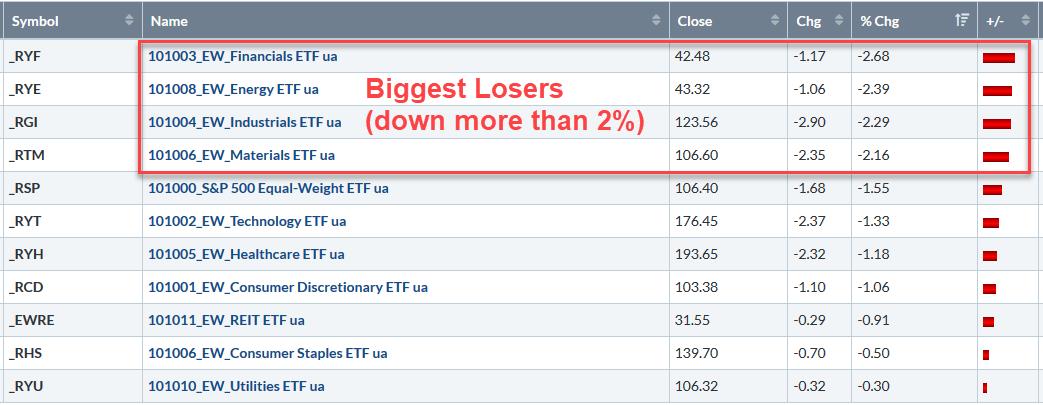
Stocks in the Industrials and Finance sectors were hit especially hard on Tuesday with XLI and XLF falling more than 2%. The Technology and Consumer Discretionary sectors held up better than the broader market by falling less than 1%. Nevertheless, these four offensive sectors were down on the day. The table below shows the 1-day ROC for RSP and 10 Equal-Weight sectors. As far as the benchmarks are concerned, SPY was down 1.2%, QQQ dropped .8% and IWM fell 2%.
------------------------------------------------------------
EW Sectors Paint Different Picture
The sector SPDRs are driven by large-caps with the top ten stocks often accounting for more than 50% of the sector weighting. As such, the price action of these SPDRs does not necessarily reflect performance for the average stock in the sector.
Chartists looking for a more balanced look at sector performance can turn to the equal-weight sector ETFs (RSP,RCD,RYF,RYT,RGI,RYH,RYE,RTM,RHS,RYU,EWRE). The first symbol, RSP, is the EW S&P 500 ETF. Volume is relatively thin for these sector ETFs so they are not well-suited for trading. However, they can be used for analysis purposes, especially when using weekly charts.
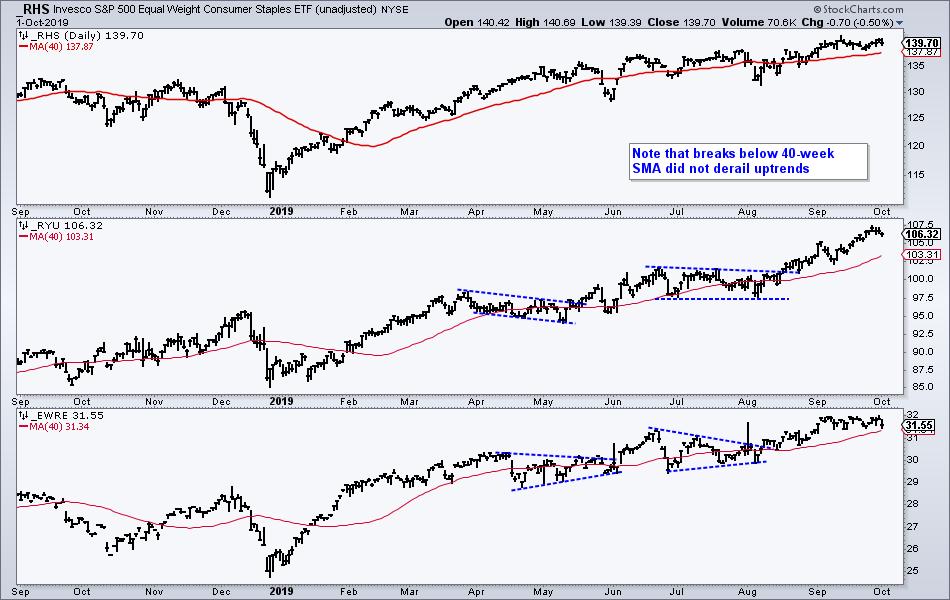
The EW Utilities ETF (RYU), EW REIT ETF (EWRE) and EW Consumer Staples ETF (RHS) are leading because they hit new highs in September. The EW Energy ETF (RYE) is by far the weakest ETF because it has not closed above its 40-week SMA since October 2018 (weekly closes).
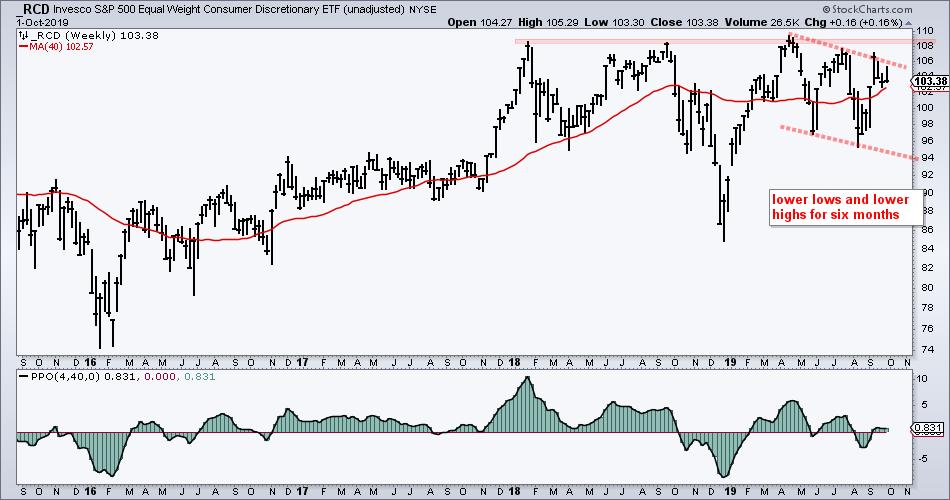
The next chart shows the EW Consumer Discretionary ETF (RCD) hitting resistance near the 2018 highs in April and then embarking on a downtrend (lower lows and lower highs). The ETF appears to be forming another lower high with a reversal/decline the last three weeks. As it's name suggests, this is the most economically sensitive sector and weakness here does not bode well for the broader market or the economic outlook.
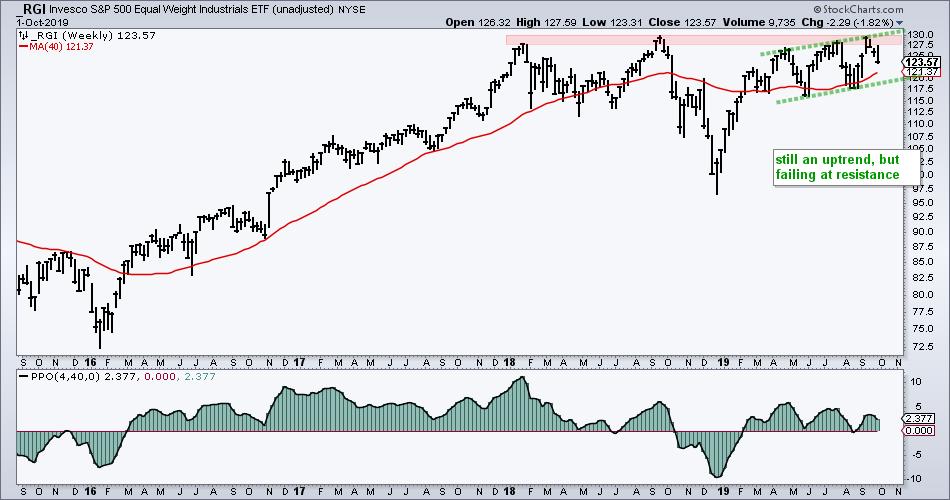
The next chart show the EW Industrials ETF (RGI) hitting a resistance zone from 2018 and falling sharply the last three weeks. Even though this sector has gone nowhere for over 18 months, the trend since April remains up with higher highs and higher lows. A break below the August low and a PPO move into negative territory would be bearish here.
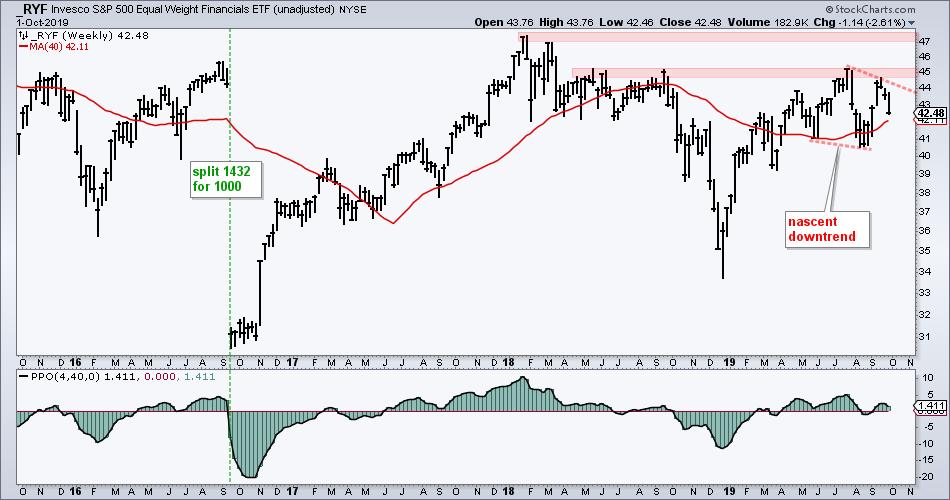
The next chart shows the EW Finance ETF (RYF) peaking below its January 2018 high and hitting resistance near the mid year high in the 45 area. The ETF formed a lower low from May to August and now appears to be forming a lower high (red dashed lines). RYF is underperforming long-term and it looks like a downtrend is getting underway. This is also negative for the Bank SPDR (_KBE) and Regional Bank ETF (_KRE).
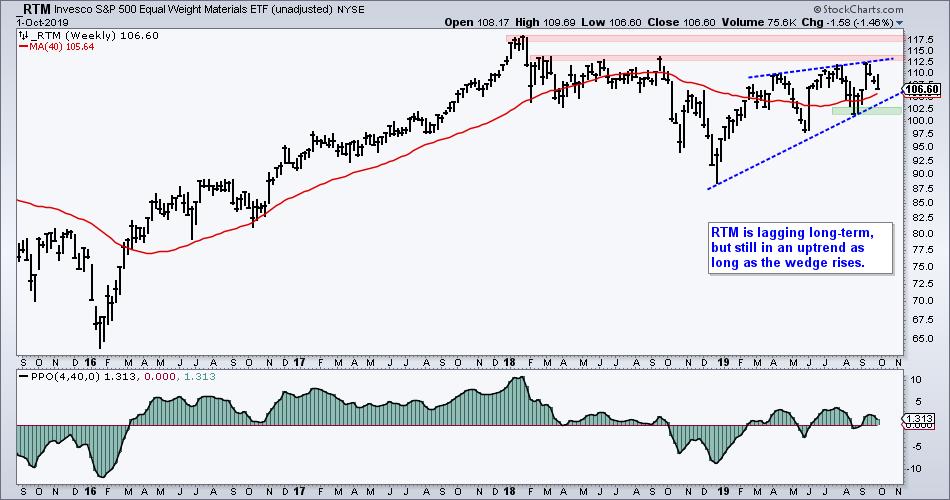
The next chart shows the EW Materials ETF (RTM) peaking below its January 2018 high and hitting resistance in the 113 area. The trend since December is still up, but a rising wedge is taking shape. These are typically bearish continuation patterns that mark counter-trend moves. A break below the August lows would reverse this uptrend and call for a continuation of the prior decline, which extended from January to December 2018.
------------------------------------------------------------
Bottom Line
Consumer Discretionary, Finance and Materials are on shaky ground now and all three are underperforming long-term. The EW Consumer Discretionary ETF (RCD) has been trending lower since April, the EW Finance ETF (RYF) has been trending lower since August and the EW Materials ETF (RTM) has a bearish wedge working. Weakness in these three sectors is weighing on the broader market.
Elsewhere, the EW Technology ETF (RYT) and EW Healthcare ETF (RYH) are underperforming on a one and three month basis. Both sector ETFs are also down on the one and three month timeframes. Healthcare is down on the six month timeframe, while Technology is up a whopping 1.61% on the six month timeframe. These are not encouraging numbers.
Taken together, five sectors on the equal-weight side of the stock market look rather shaky and one is outright bearish (Energy). This is not a good recipe for the stock market going forward. I do not see enough weakness now to justify a bear market environment, but there are enough pockets of weakness to make life difficult for the bulls.
Choose a Strategy, Develop a Plan and Follow a Process
Arthur Hill, CMT
Chief Technical Strategist, TrendInvestorPro.com
Author, Define the Trend and Trade the Trend
Want to stay up to date with Arthur's latest market insights?
– Follow @ArthurHill on Twitter


