 The number of stocks making new highs has been a lagging link in the breadth indicators this year. While the S&P 500 trades at a new high, the number of new highs within the index has yet to exceed 100 and get back to the levels seen in June. New highs in the S&P Small-cap 600 and S&P MidCap 400 are also uninspiring and well below the levels seen in 2017 and 2018. This may be changing as new highs expanded in the small-cap universe over the last few weeks. This post will first look at the high-low pairs for the S&P indexes and then apply a 20-day SMA to show the improvement in new highs over the last few weeks.
The first chart shows the High-Low pairs for the S&P 500, S&P 400 MidCap and S&P 600 SmallCap indexes with lines at the 10% levels (e.g. plus/minus 50 for $SPX, plus/minus 40 for $MID and plus/minus 60 for $SML). First, notice that new lows in the S&P 500 have not exceeded 50 (-50) since December and new highs have exceeded 50 numerous times this year. Second, notice that new lows expanded in May and August and exceeded 40 for mid-caps and 60 for small-caps. Large-caps held up better in May and August.
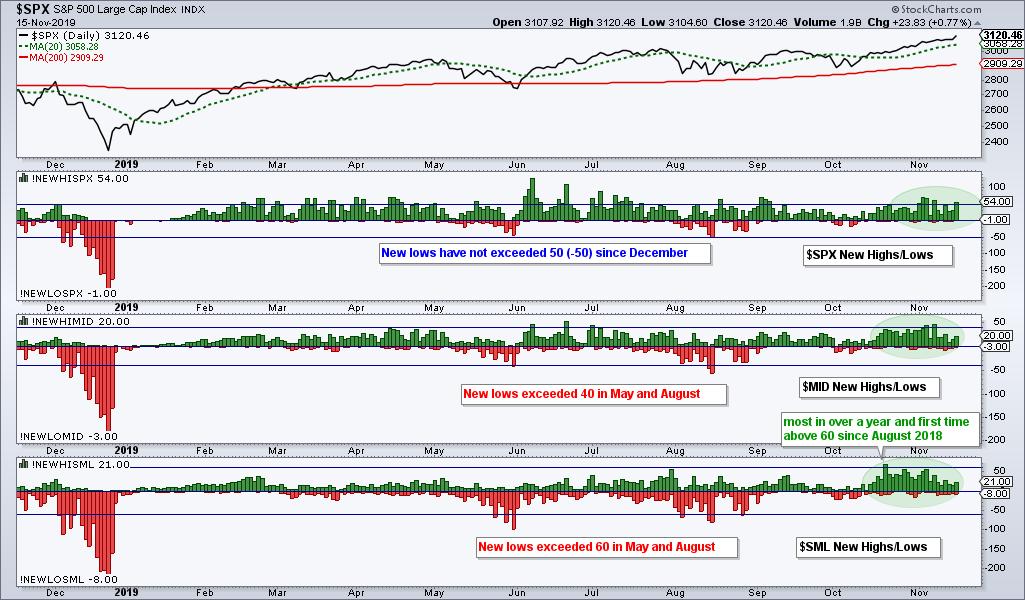
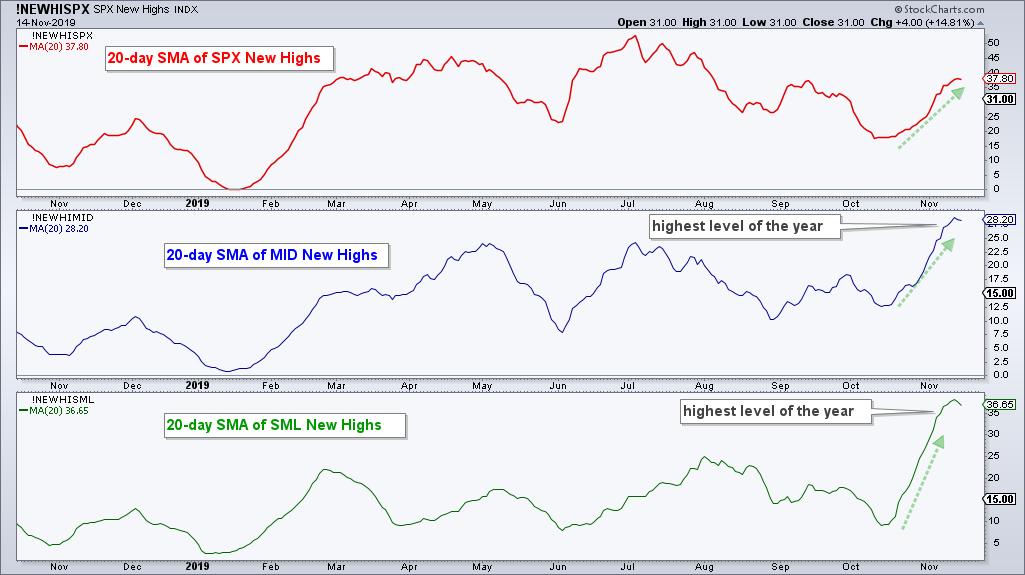
What about the right side of the chart, which is the most important side. New highs in small-caps and mid-caps increased over the last four weeks and this indicates a broadening of the bull market. The green shading on the chart above shows a steady stream of new highs since mid October. The chart below quantifies this by showing the 20-day SMAs of new highs for each index. The 20-day SMAs of Mid-cap New Highs (!NEWHIMID) and Small-cap New Highs (!NEWHISML) hit their highest levels of the year this week. New highs are the strongest of the year and this is positive for mid-caps and small-caps.
The number of new highs within small and mid caps is still below the levels seen in 2017 and early 2018, but this is a good start. Looking for ETFs or stocks poised to break out and lead as the bull market broadens? Check out TrendInvestorPro.com, home of objective, systematic and sober analysis from Arthur Hill, CMT.
Geared towards the weekend trader or investor, TrendInvestorPro offers:
- Systematic ETF rankings and analysis (Thursdays)
- ChartBook with annotated charts for 60 core ETFs (Thursdays)
- Market timing models and broad market commentary (Fridays)
- Stock setups and chart analysis (Saturdays)
- Weekly video analysis and commentary (Saturdays)
Subscribe today for immediate access!
----------------------------------------------------------------------------------------------------------
Choose a Strategy, Develop a Plan and Follow a Process
Arthur Hill, CMT
Chief Technical Strategist, TrendInvestorPro.com
Author, Define the Trend and Trade the Trend
Want to stay up to date with Arthur's latest market insights?
– Follow @ArthurHill on Twitter


