 The S&P 500 SPDR and Nasdaq 100 ETF recorded new all time highs this past week, while the S&P MidCap 400 SPDR hit a new 52-week high in November. Sounds bullish, but the S&P SmallCap 600 SPDR and Russell 2000 ETF are still well below their 2018 highs, even though they are very close to 52-week highs. Which index ETFs tell the real story here?
Broad market analysis is all about the weight of the evidence. There are hundreds of stocks, dozens of industry groups, ten to eleven sectors and a few broad indexes. Chartists looking for positive or bullish indications can find them if they look hard enough. The same is true with negative or bearish indications. Our job as chartists is to analyze the charts objectively and weigh the evidence. Right now, I think the bullish evidence clearly outweighs the bearish evidence.
The chart below shows the S&P 500 SPDR, the S&P 500 EW ETF and the Russell 2000 ETF. The new all time high in SPY shows broad strength in large-caps because SPY is heavily weighted towards large-cap stocks. We can remove this large-cap bias by looking at the S&P 500 Equal-Weight ETF. Even with a level playing field, RSP also recorded an all time high. This points to broad strength within the S&P 500 and this is bullish for stocks.
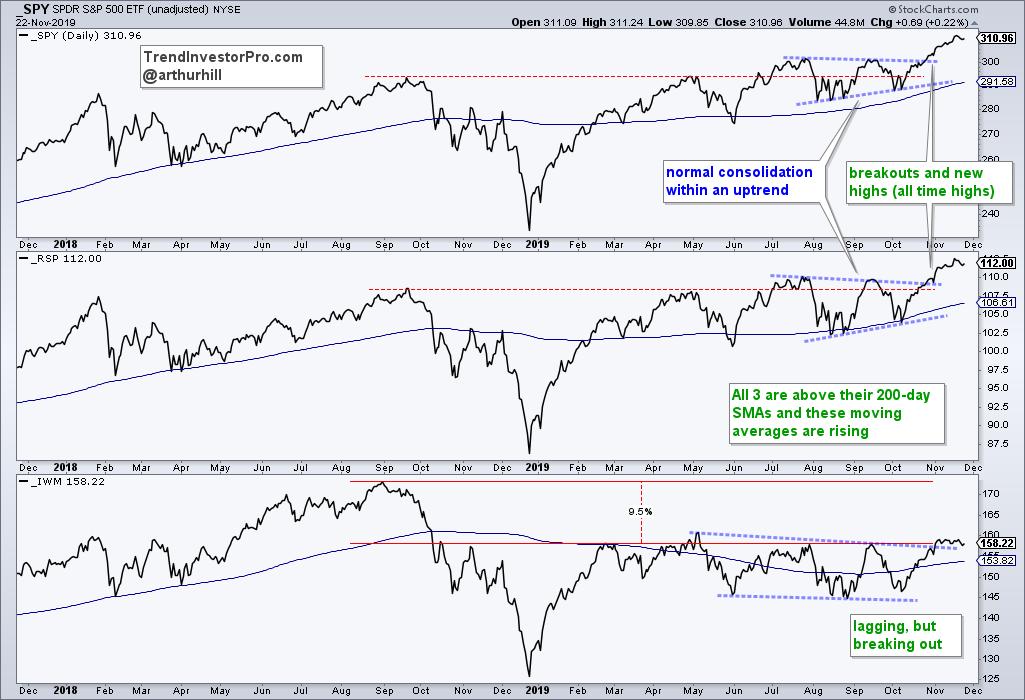
IWM is clearly the laggard because it remains around 9.5% below its 2018 high. IWM, however, represents less than 10% of the total investable equity market. The S&P 500, on the other hand, accounts for around 80%. The S&P 500 is the 800 pound gorilla in the room here. In any case, the IWM chart is also constructive with a channel breakout and six month high in late October.
The stock market is not perfectly bullish and there is always something to be concerned about, especially if we look hard enough. The trick is to keep the analysis simple and weigh the evidence. As the tally below shows, there are strong uptrends in SPY, QQQ and RSP. MDY is also in an uptrend. We can question the relative strength for IWM and IJR, but these two are also in uptrends of some sort.
- New All Time Highs: SPY, QQQ, RSP
- New 52-week Highs: SPY, QQQ, RSP, MDY
- Above 200-day SMA: SPY, QQQ, RSP, MDY, IWM, IJR
- Rising 200-day SMA: SPY, QQQ, RSP, MDY, IWM, IJR
Looking for objective, systematic and sober analysis? Check out TrendInvestorPro.com
Each week we cover a core group of 60 ETFs with a unique grouping and ranking methodology. There is an accompanying ChartBook and a weekend video produced on Saturday mornings. Today I singled out four ETFs that look poised to move.
Subscribe today for immediate access!
--------------------------------------------------------------------------------------
Choose a Strategy, Develop a Plan and Follow a Process
Arthur Hill, CMT
Chief Technical Strategist, TrendInvestorPro.com
Author, Define the Trend and Trade the Trend
Want to stay up to date with Arthur's latest market insights?
– Follow @ArthurHill on Twitter


