 The Gold SPDR (GLD) and the Gold Miners ETF (GDX) have been trending lower and lagging the broader market since September, but breadth indicators show signs of strength within the Gold Miners ETF. Today we will examine four breadth indicators and analyze the price chart for GDX. While breadth can help our analysis process, keep in mind that price is still the ultimate arbiter.
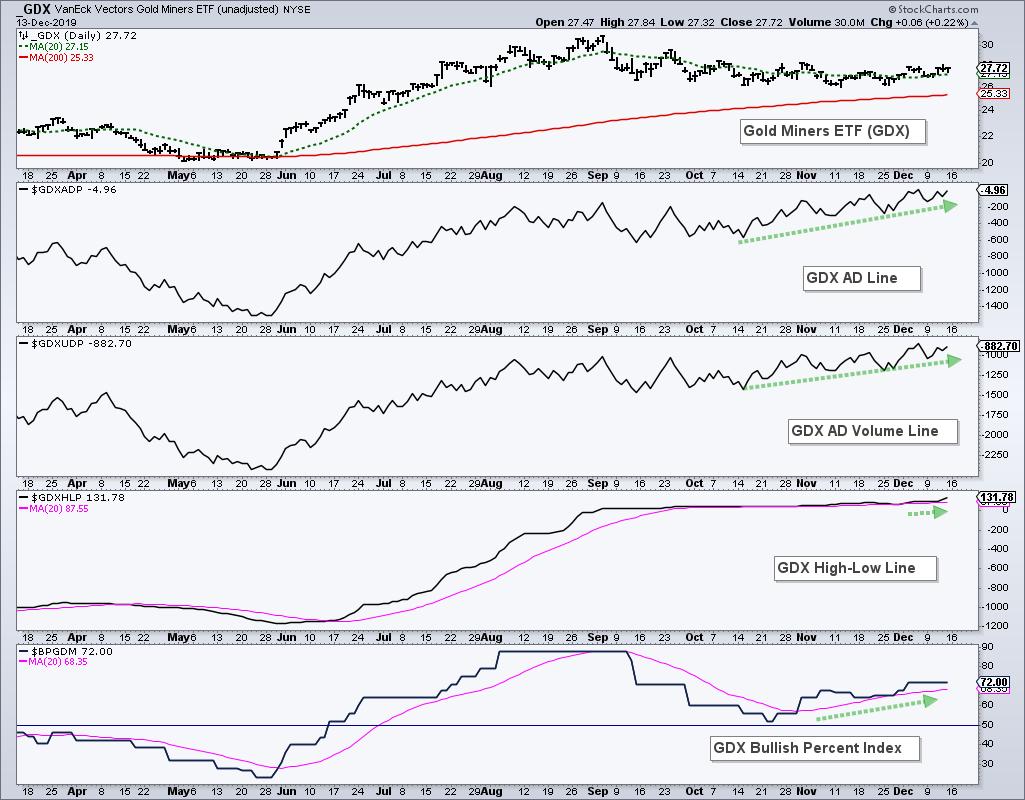
First, note that StockCharts calculates and publishes the base indicators required for these breadth lines. Advance-Decline Percent ($GDXADP) is used for the Advance-Decline Line, AD Volume Percent ($GDXUDP) is use to plot the AD Volume Line and High-Low Percent ($GDXHLP) is used for the High-Low Line. All three are cumulative indicators of the base indicator. You can also click on this chart to see the settings and save it to a ChartList.
The chart below shows the Advance-Decline Line and AD Volume Line turning up in mid October and hitting new highs in December. The High-Low Line flattened from September to October, but turned up ever so slightly and is above its 20-day EMA. A rising High-Low Line means new highs are outpacing new lows. The last indicator shows the Bullish Percent Index ($BPGDM) turning up in mid October and holding above its 20-day EMA.
The next chart shows GDX with a corrective pattern and a clear resistance zone to watch. First, the ETF surged some 53% and then retraced half of this advance with a falling wedge. Both the pattern and the retracement amount are typical for corrections within a bigger uptrend. GDX is at a most interesting juncture right now because it could be poised for a breakout and continuation of the bigger uptrend.
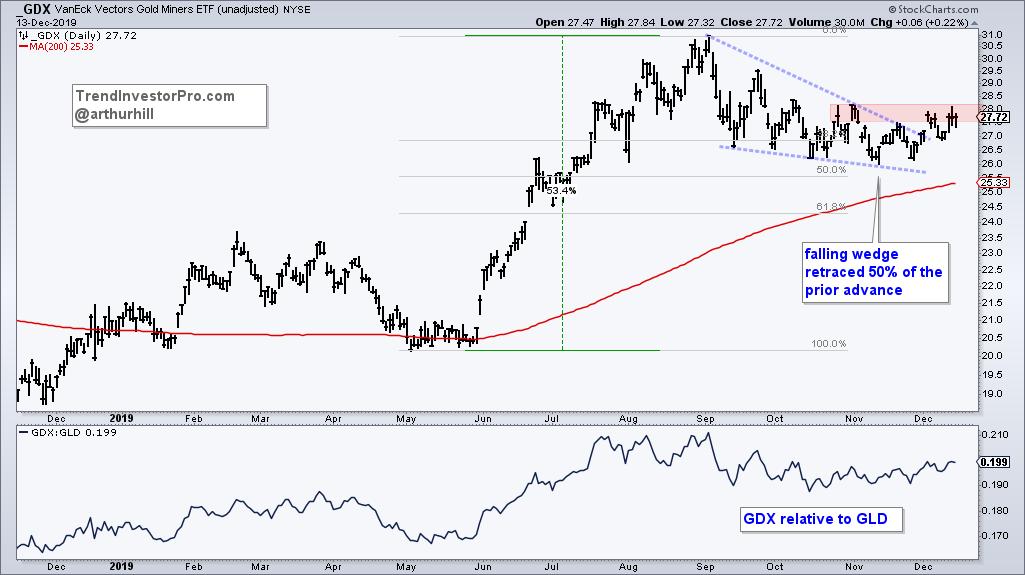
GDX broke above the upper wedge line at the end of November and this breakout held for the most part. The ETF is now challenging a clear resistance zone 27.5-28.2 area. Strength in the breadth indicators and the wedge line break suggest GDX will break out and continue higher. A close below last week's low and a buffer (say 26.5) would call for a re-evaluation.
And remember, price action of the underlying is more important than breadth, volume or relative performance. We make or lose money based on the price movements of the actual security, not the indicator.
Special Offer for StockCharts members!
Solid analysis starts with focus! We need to tune out the noise and narrow our analytical focus. This starts with a robust chart list that narrows our universe. Tired of wading through thousands of ETFs? Let TrendInvestorPro.com do the work for you with a comprehensive and focused list of carefully chosen ETFs.
These ETFs are organized with numerical prefixes that make it easy to follow a top-down analysis process with just one ChartList. The TrendInvestorPro ChartList includes a core list of 60 ETFs and a master list of 200 ETFs. Subscribe to TrendInvestorPro with the email you used to sign-up or log-in to StockCharts and I will share this ChartList. Note that you must be an Extra or Pro member of StockCharts to have more than one ChartList. Those who are not StockCharts members can download a CSV file and upload the list to their preferred charting platform.
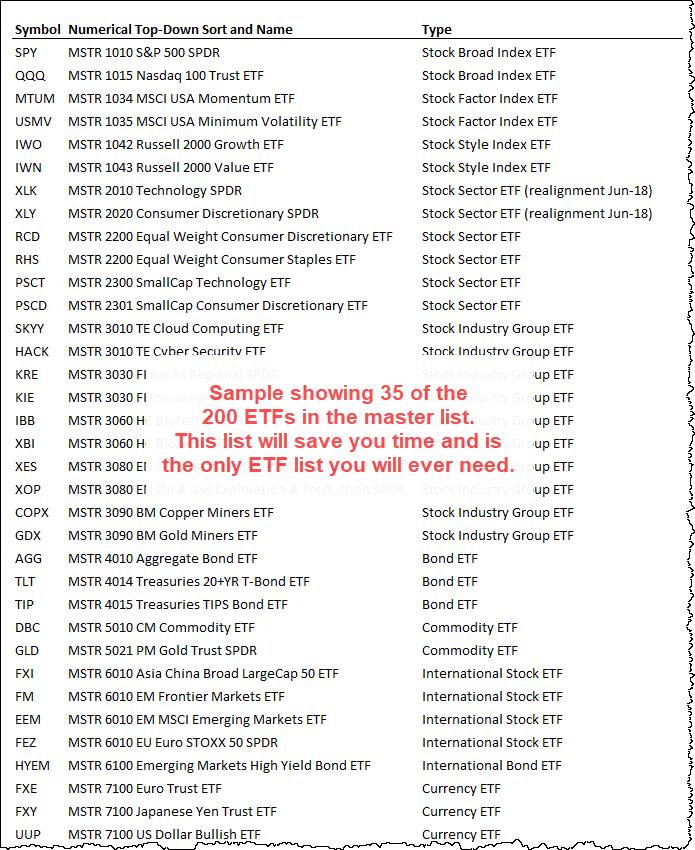
The master list includes: 8 Broad Index ETFs, 6 Factor ETFs, 8 Style ETFs, 31 Sector ETFs, 51 Industry Group ETFs, 17 Fixed Income ETFs, 6 Commodity ETFs, 54 International ETFs, 11 Currency ETFs and a few others. The core list refines this master list by filtering out ETFs with low volume and reducing redundancy.
Click here to take your analysis to the next level!
-------------------------------------------------------------------
Choose a Strategy, Develop a Plan and Follow a Process
Arthur Hill, CMT
Chief Technical Strategist, TrendInvestorPro.com
Author, Define the Trend and Trade the Trend
Want to stay up to date with Arthur's latest market insights?
– Follow @ArthurHill on Twitter


